How to Test Distinctive Brand Assets in Loops: A Step-by-Step Guide
by Sam Reid in
10 min read
In Part 1 of this series, we covered what makes brand assets truly distinctive and why the Ehrenberg-Bass methodology is the gold standard for measuring them. This article walks through the practical implementation: how to actually set up, run, and interpret a distinctive brand asset test using the Loops platform.
Traditional asset testing can take 8-12 weeks and cost $50k-$100K+. The Loops approach delivers results in days with human respondents across 85+ markets. Here's exactly how it works.
Step 1: Isolate Your Brand Assets Without Losing Context
The first challenge in DBA testing is removing brand identifiers (logos, wordmarks, company names) while keeping the asset recognizable enough to test. Remove too much and you're testing nothing. Remove too little and you're measuring logo recognition, not asset distinctiveness.
Loops includes an AI-powered asset decomposition tool that automates this process.
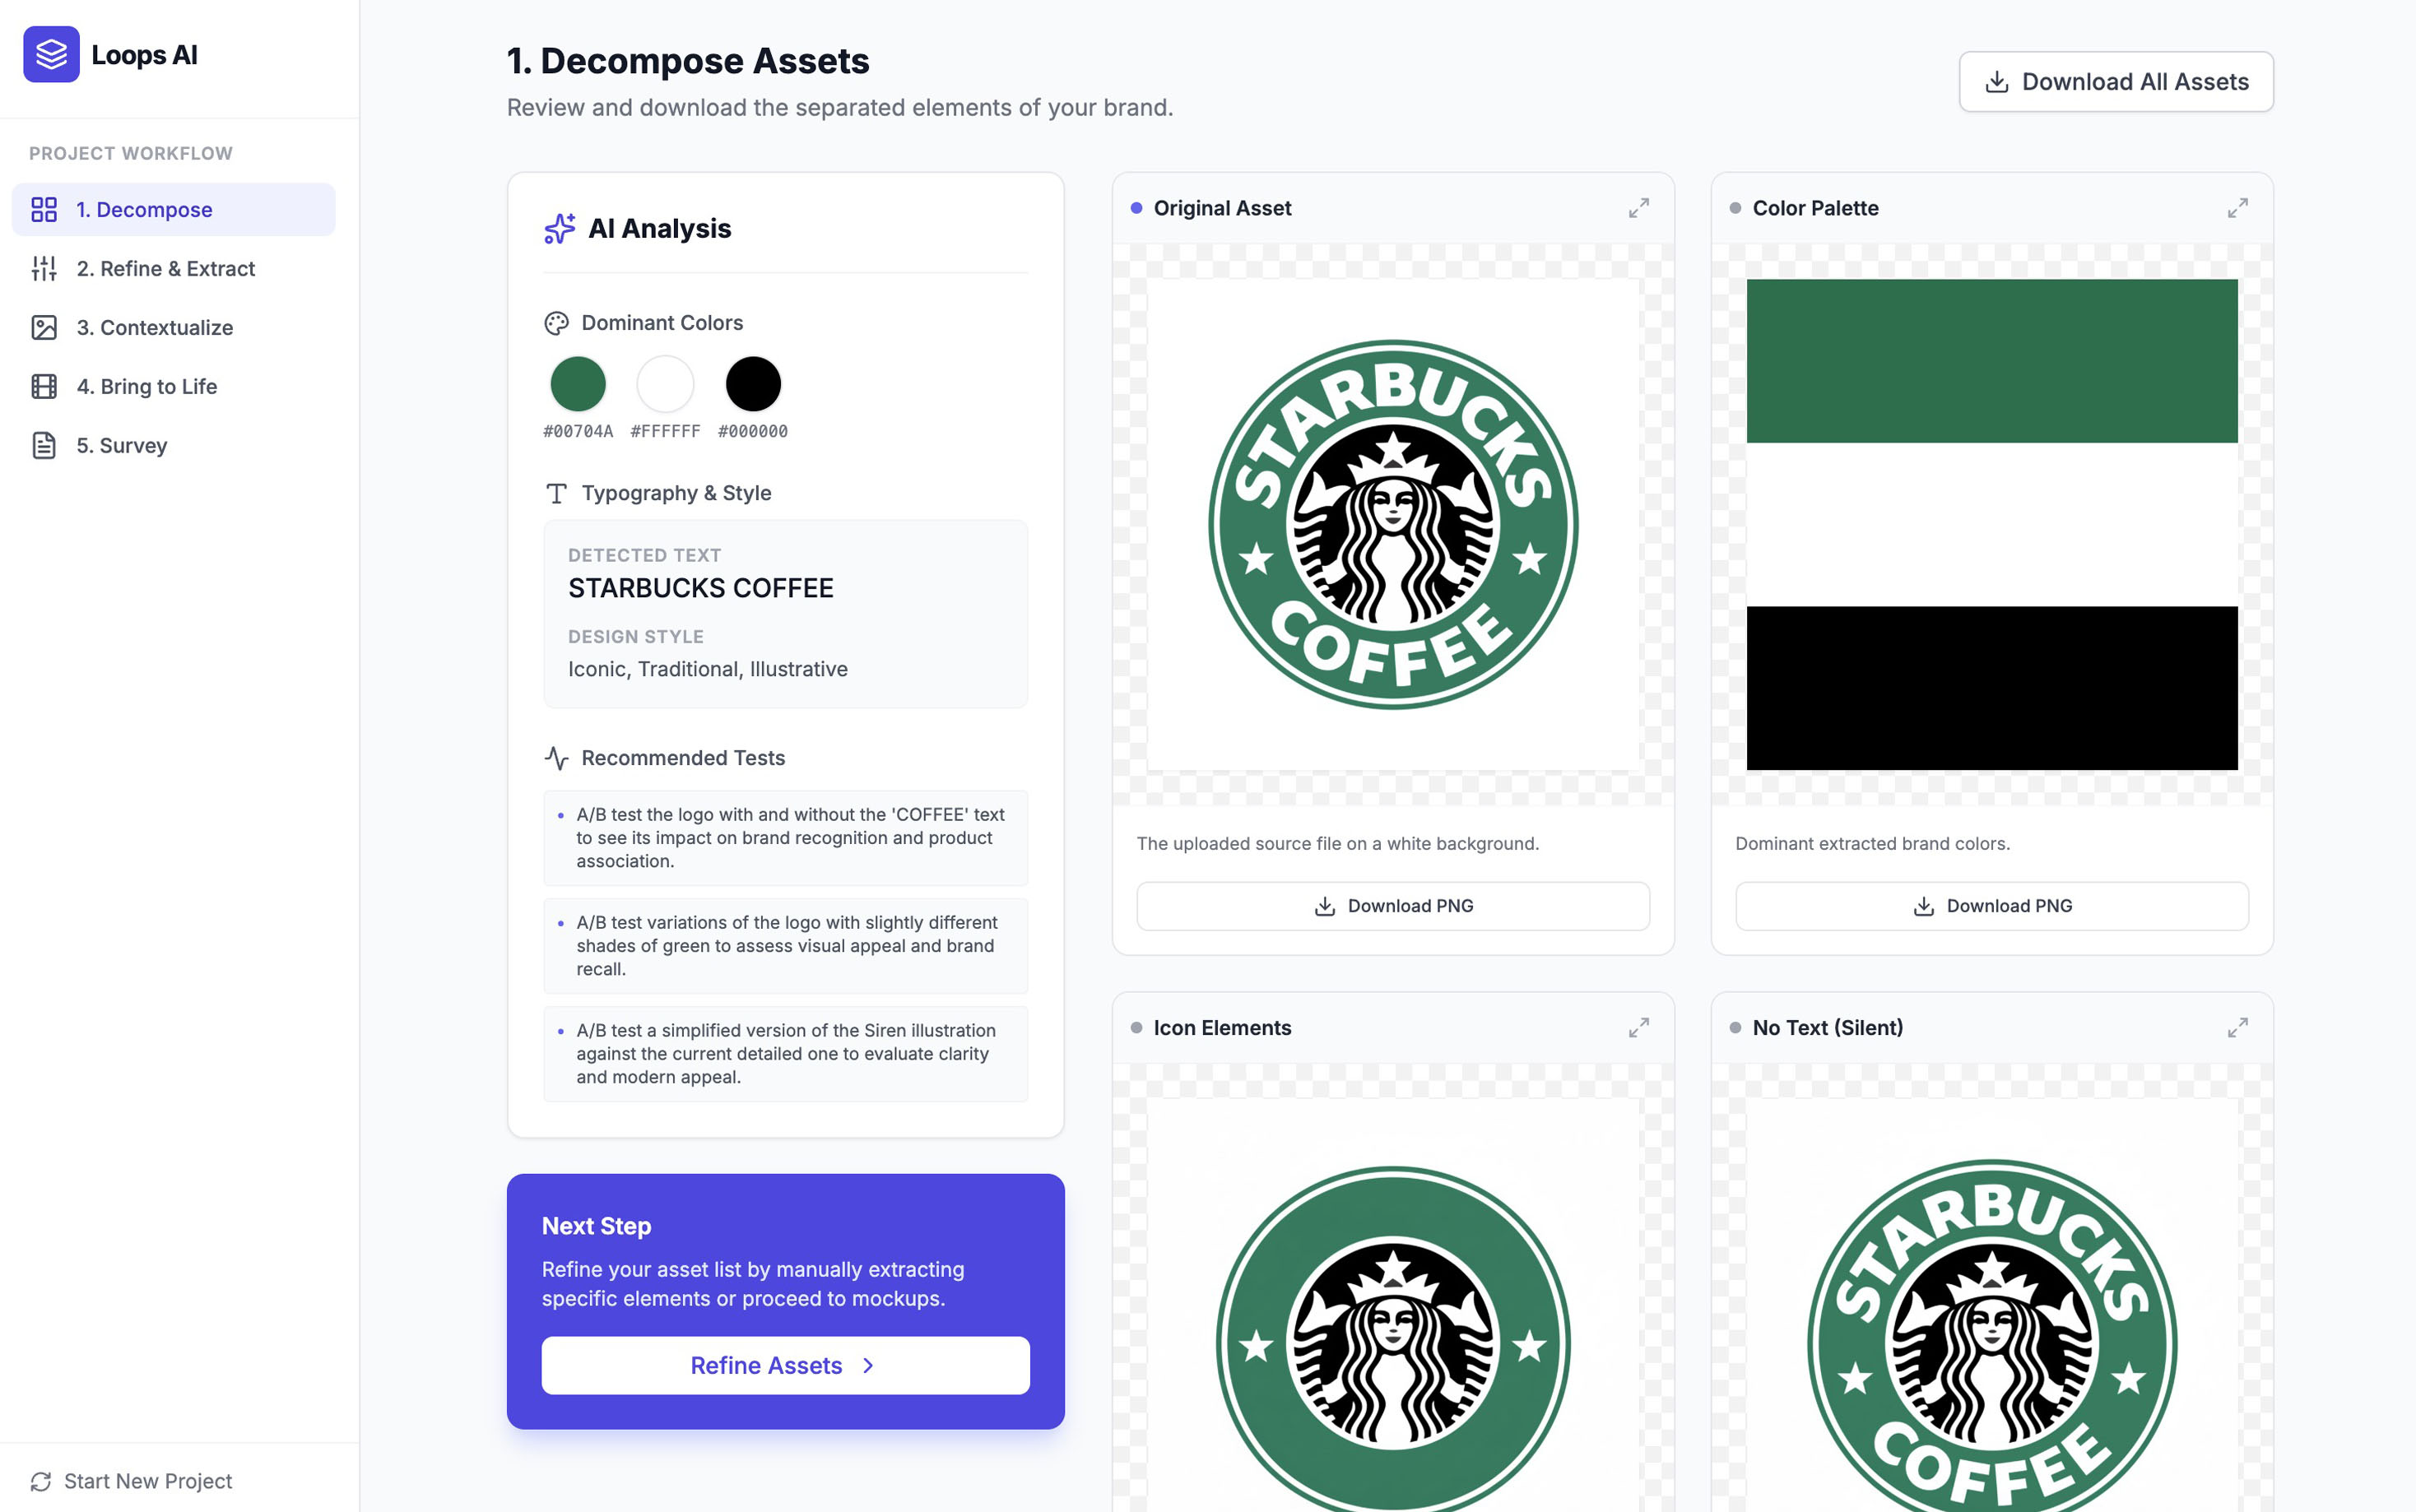
Starbucks logo decomposition
How this Feature Works
Upload your brand asset (logo, packaging, advertisement, product image). The feature automatically:
Extracts dominant colors with exact hex codes
Identifies typography style and detects text elements
Isolates icon/symbol elements from text
Generates in-situ asset variants with identifiers removed
Recommends specific tests based on the asset structure
For the Starbucks example above, the tool identified:
Primary color: Green (#00784A) - testable as a color swatch
Secondary color: Black (#FFFFFF for contrast)
Icon element: The siren figure inside the circular badge - testable as a standalone symbol
Text element: "STARBUCKS COFFEE" wordmark - separately testable as typography
Places DBA elements in real work scenarios and even create video clips e.g. mobile scroll
You can then add each isolated element for testing.
Why this matters: Manual asset isolation is time-consuming . The AI approach is fast, and generates multiple test variants automatically. You can test the full logo minus text, just the color palette, just the icon, or just the typography, into any real world scenario, all from one upload.
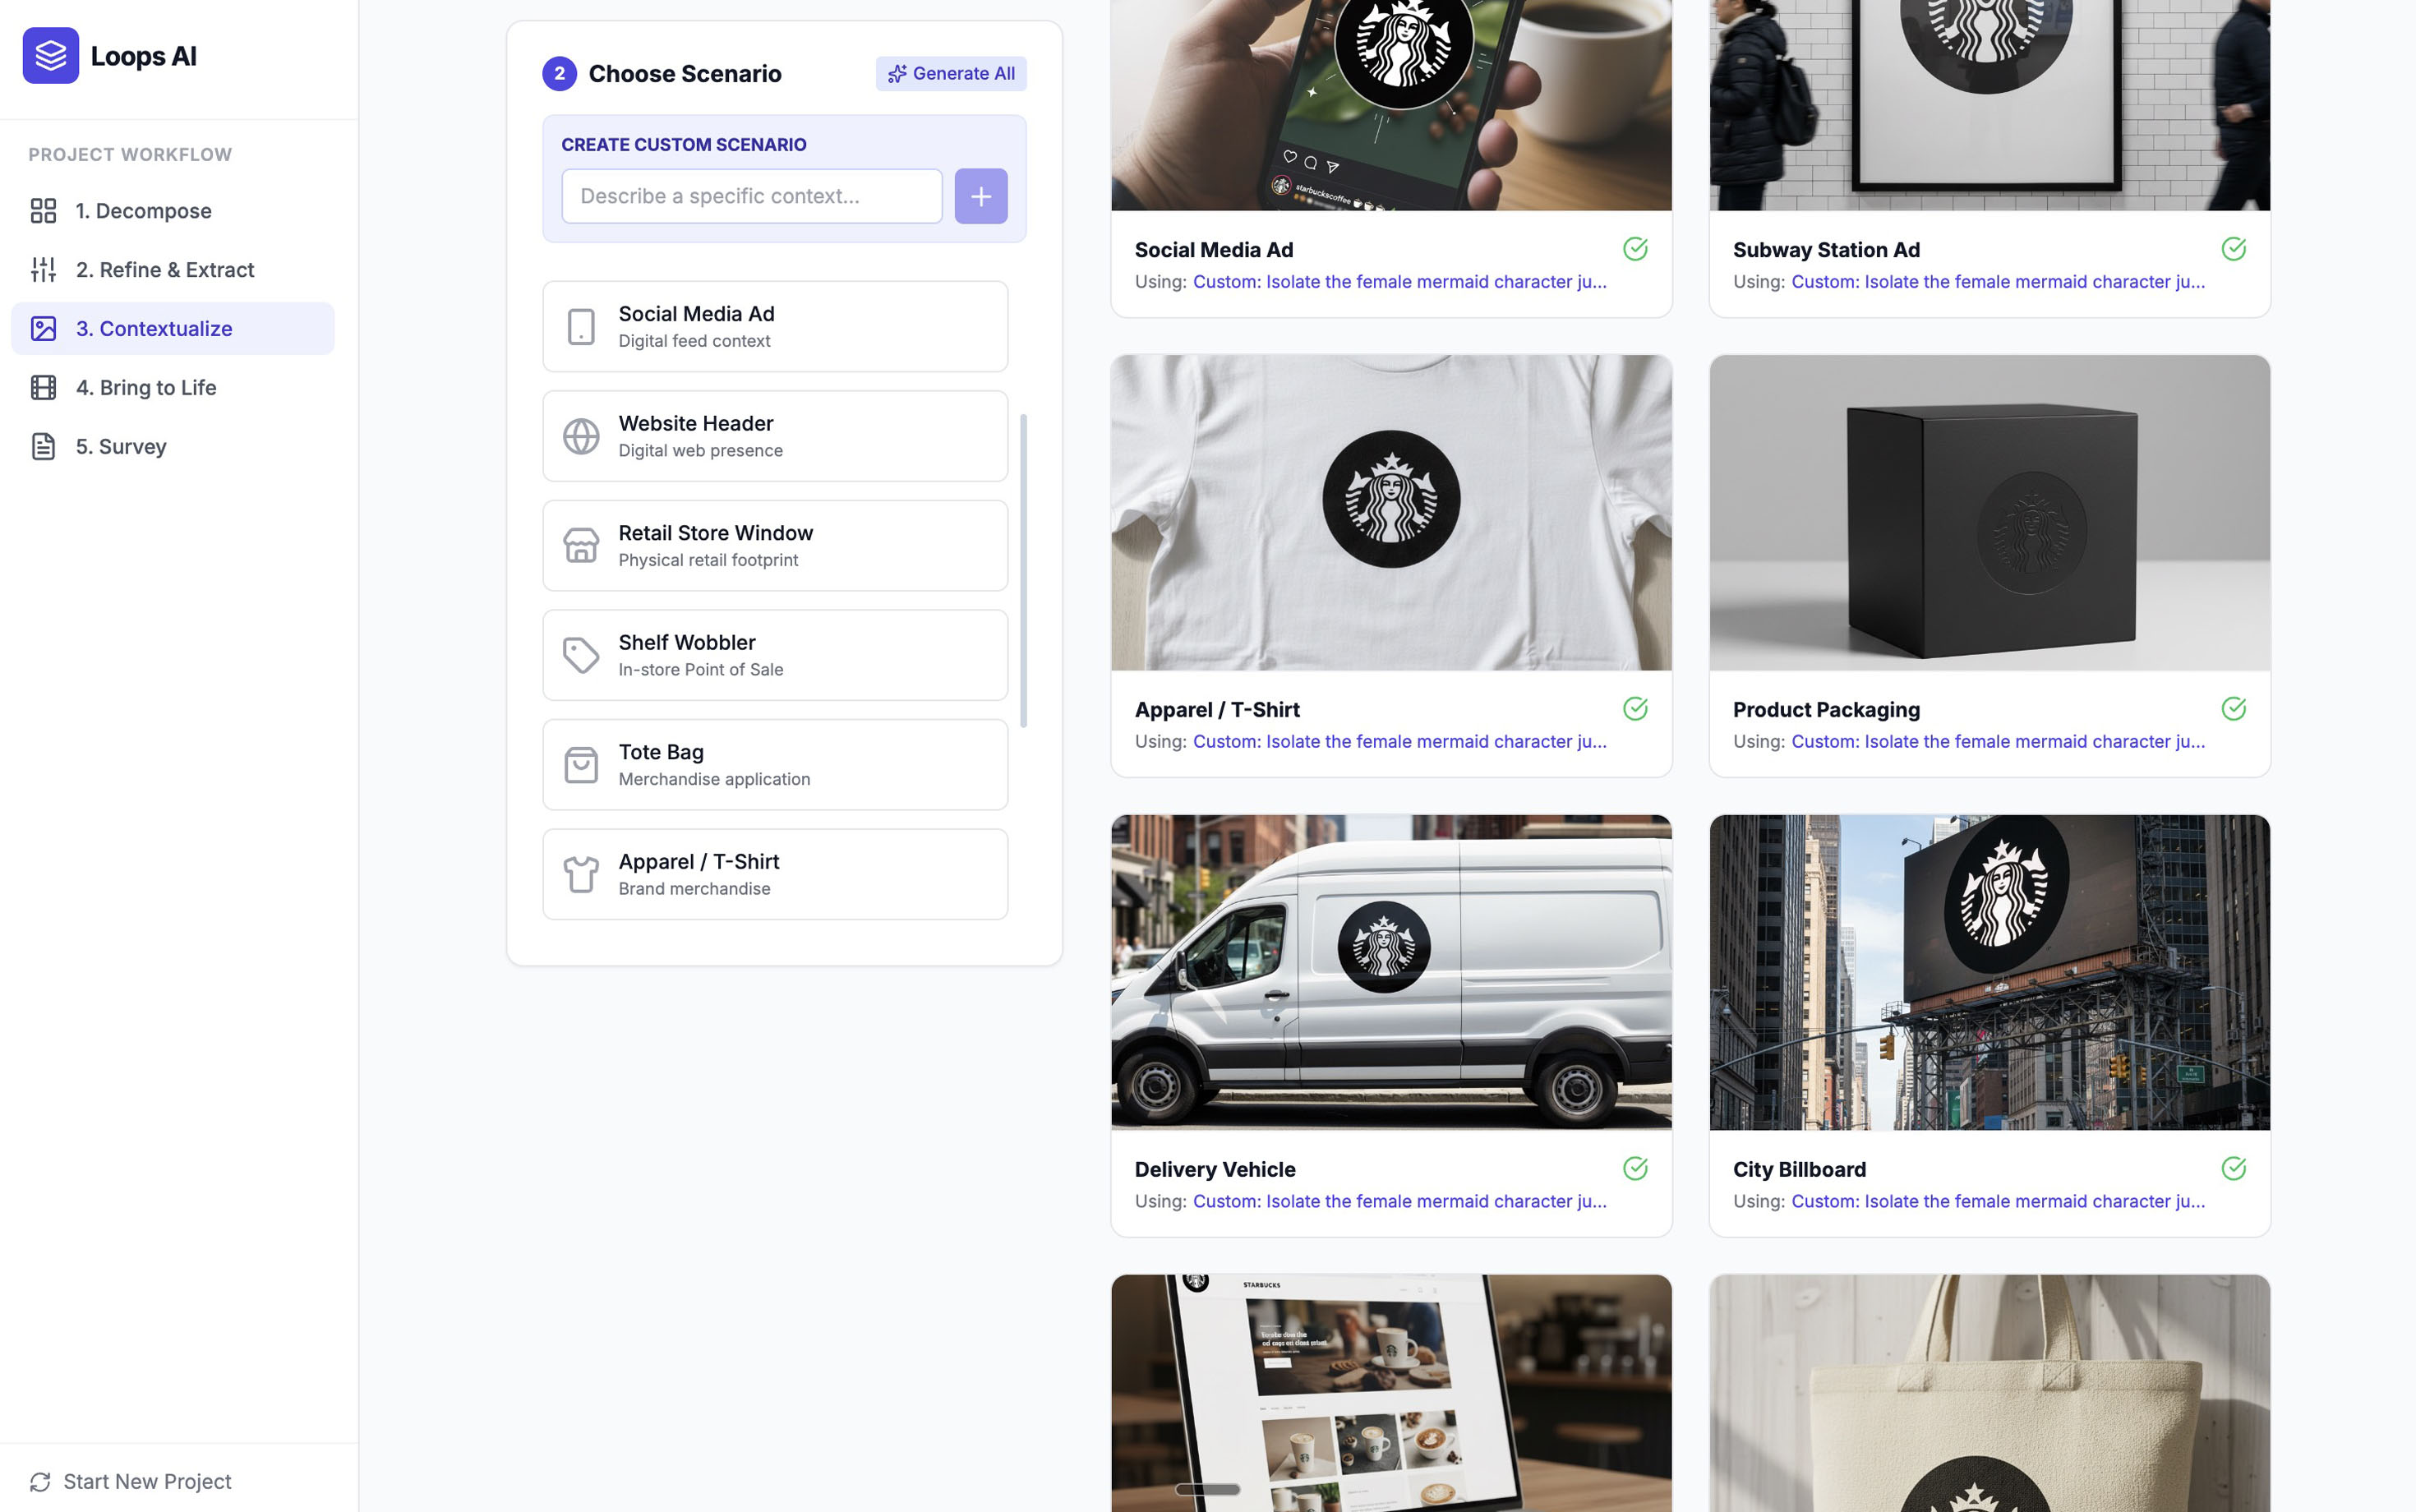
Assets in situ
Placing Assets In Situ
Testing a color swatch in isolation tells you one thing. Testing that same color on a realistic package mockup or advertisement tells you something more valuable: seeing how the asset performs in real-world contexts.
The platform includes mockup templates for:
Retail shelf environments (on-shelf product visibility)
Out-of-home advertising (subway posters, billboards)
Digital environments (mobile app interfaces, web banners)
Packaging formats (bottles, boxes, bags, cans)
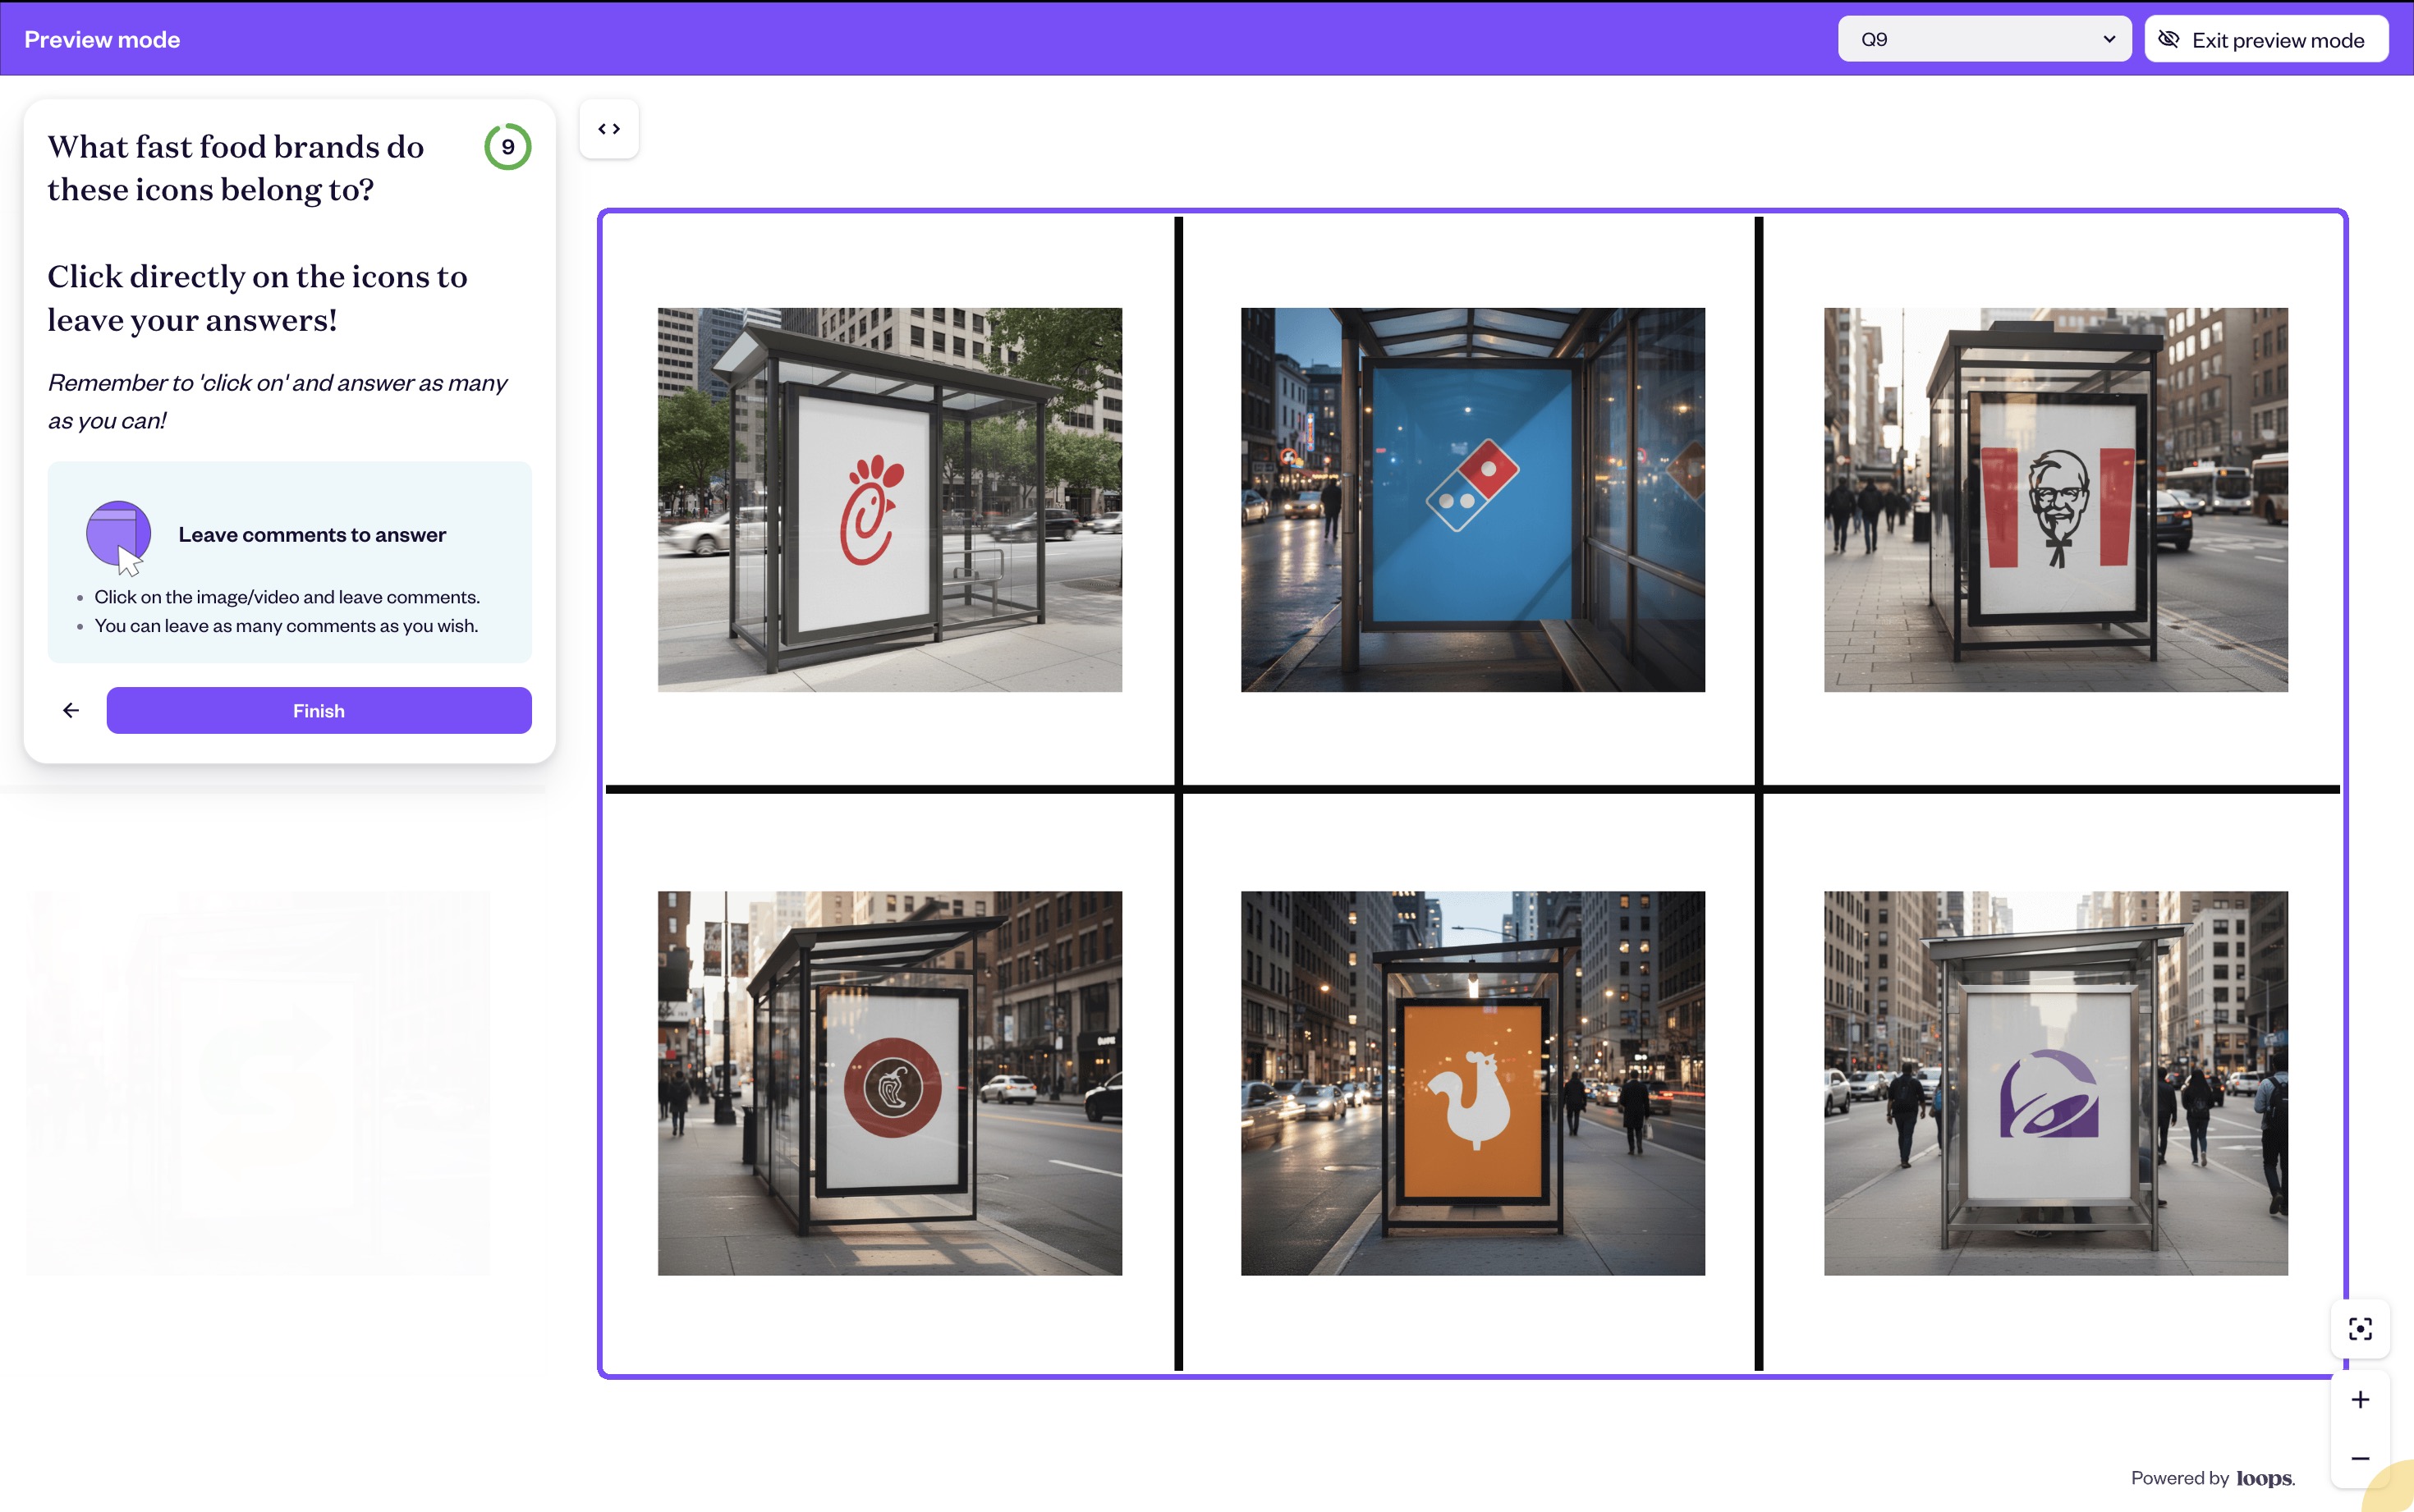
The example image below shows this in practice: six different fast food brand icons placed on identical subway poster mockups. The standardized context lets you isolate the variable that matters, the icon itself, while maintaining environmental realism.
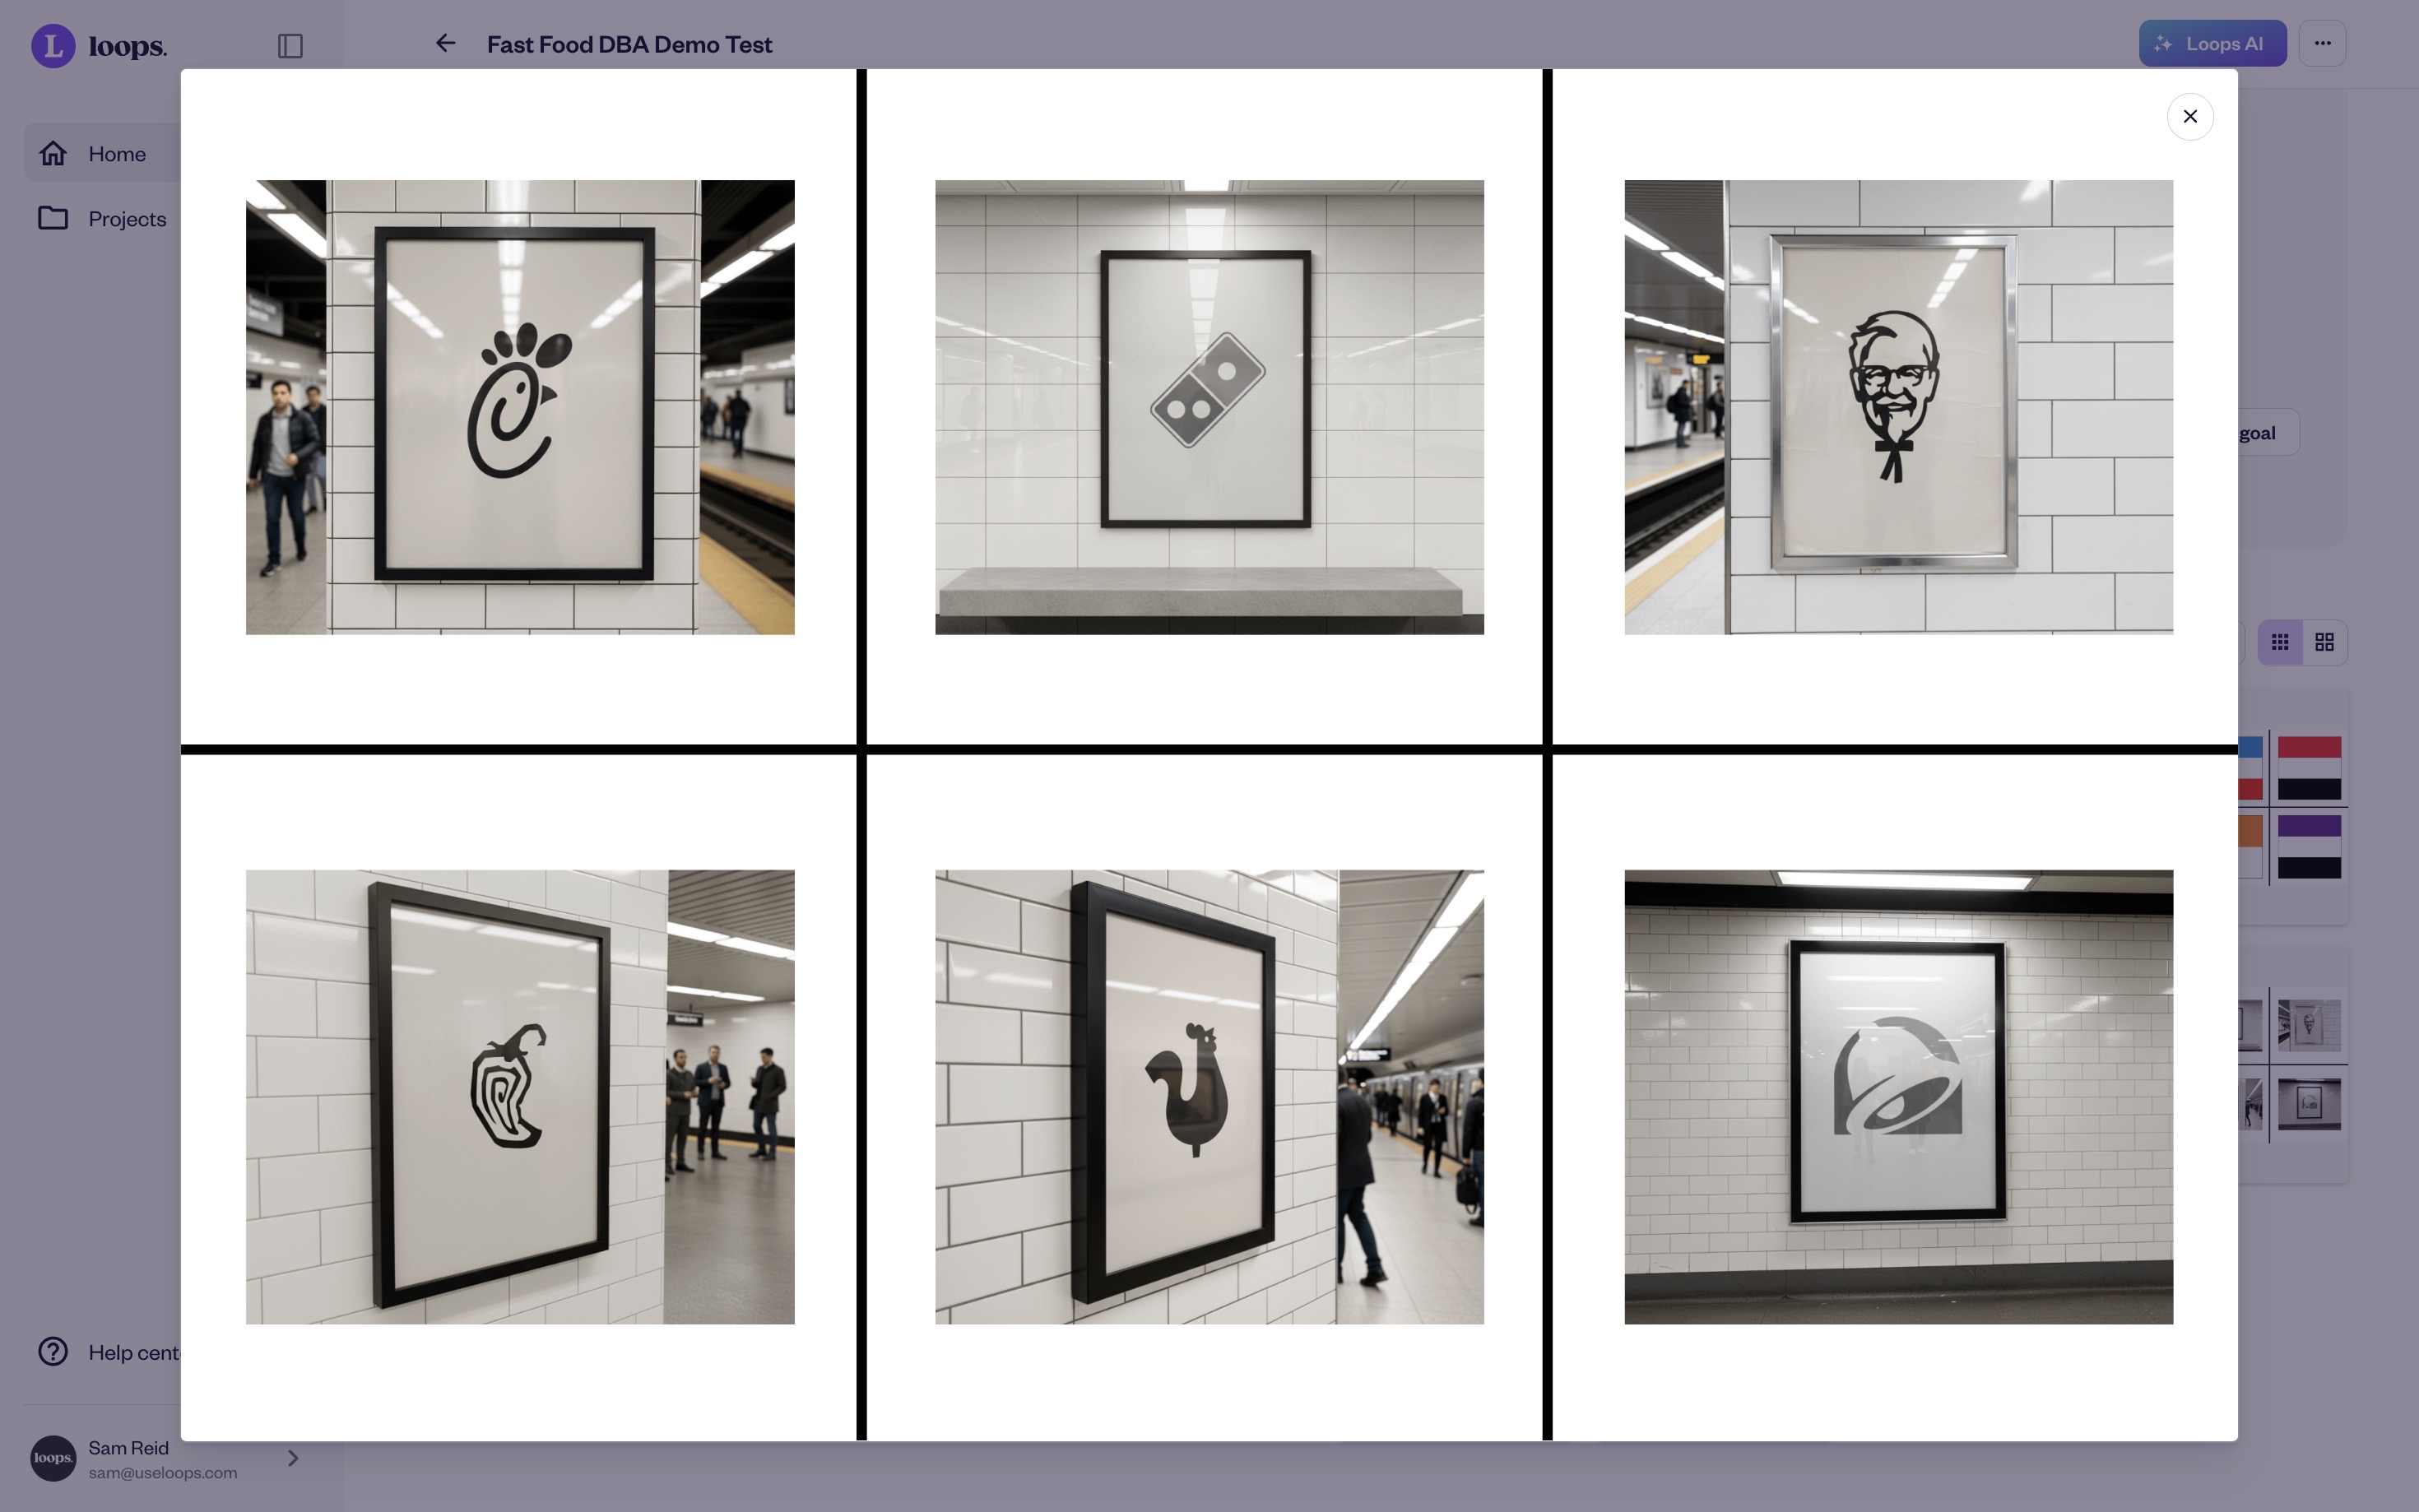
Standardisation is key
Step 2: Set Up Category-Competitive Benchmarking
An asset that scores 60% Fame in isolation means nothing without category context. Is 60% high or low for your category? That depends entirely on competitive density and category maturity.
The Loops platform enables category-level testing through multi-asset comparison studies in-situ.
Real world concepts
How to Structure a Category Benchmark Test
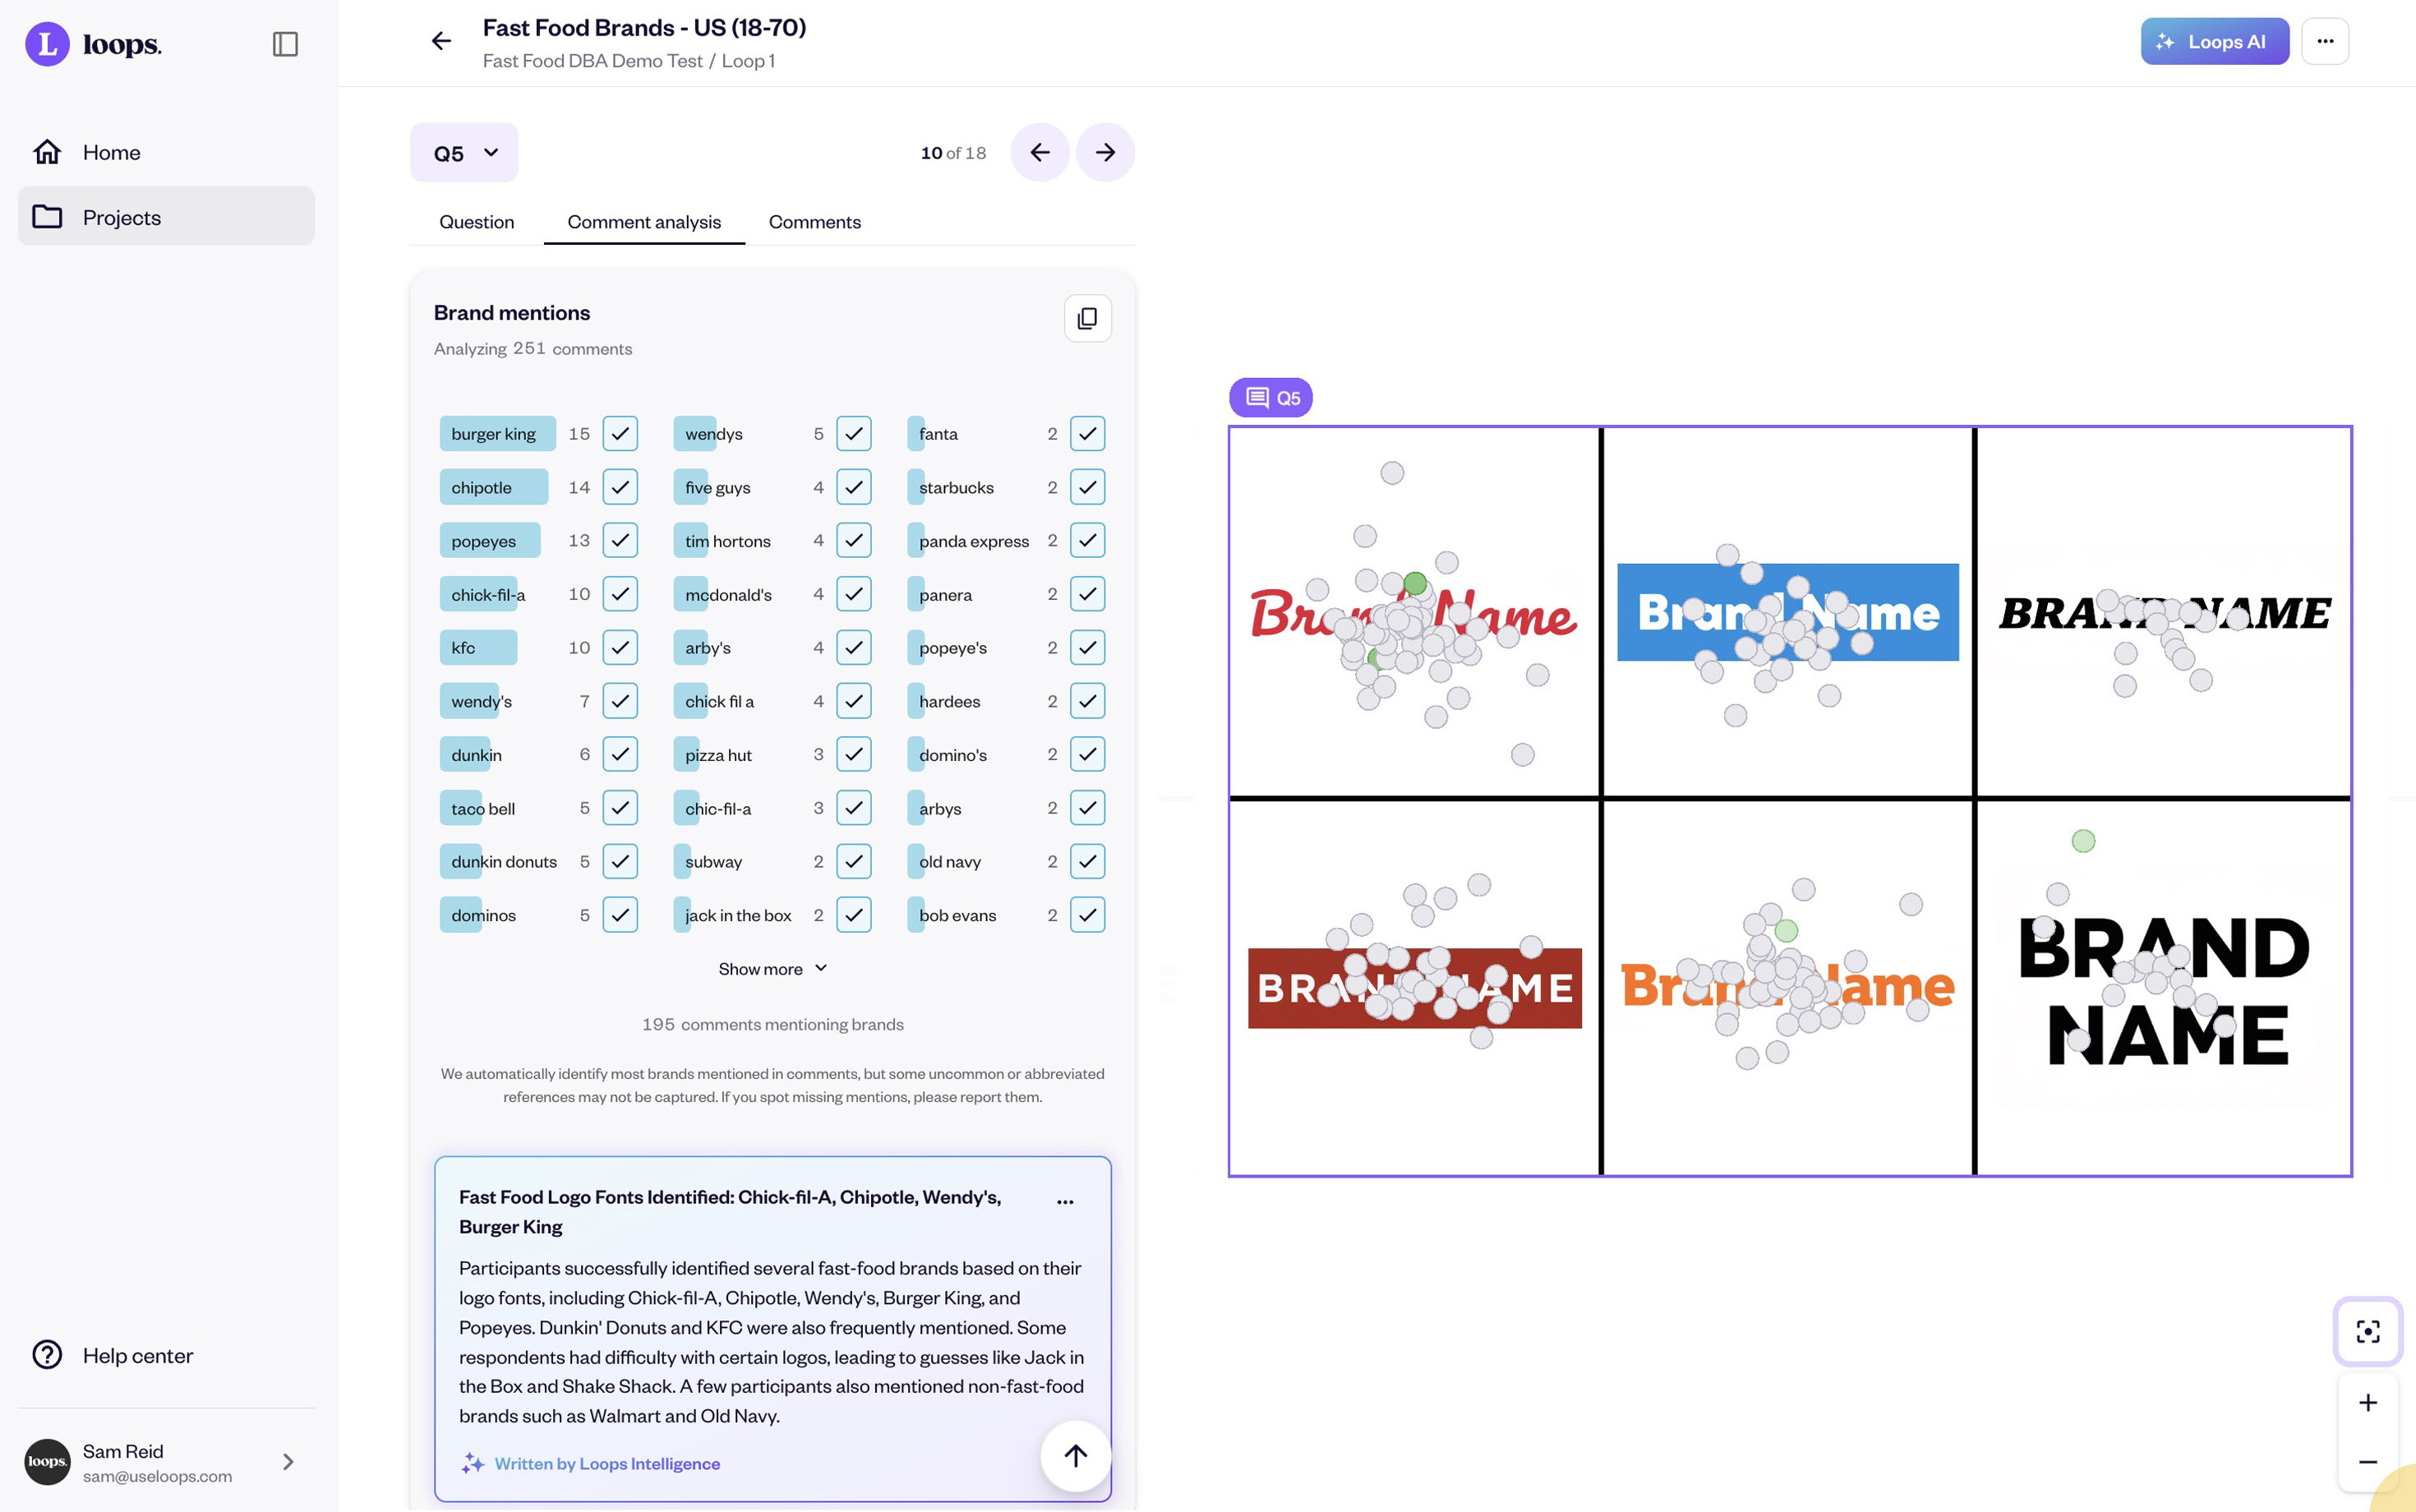
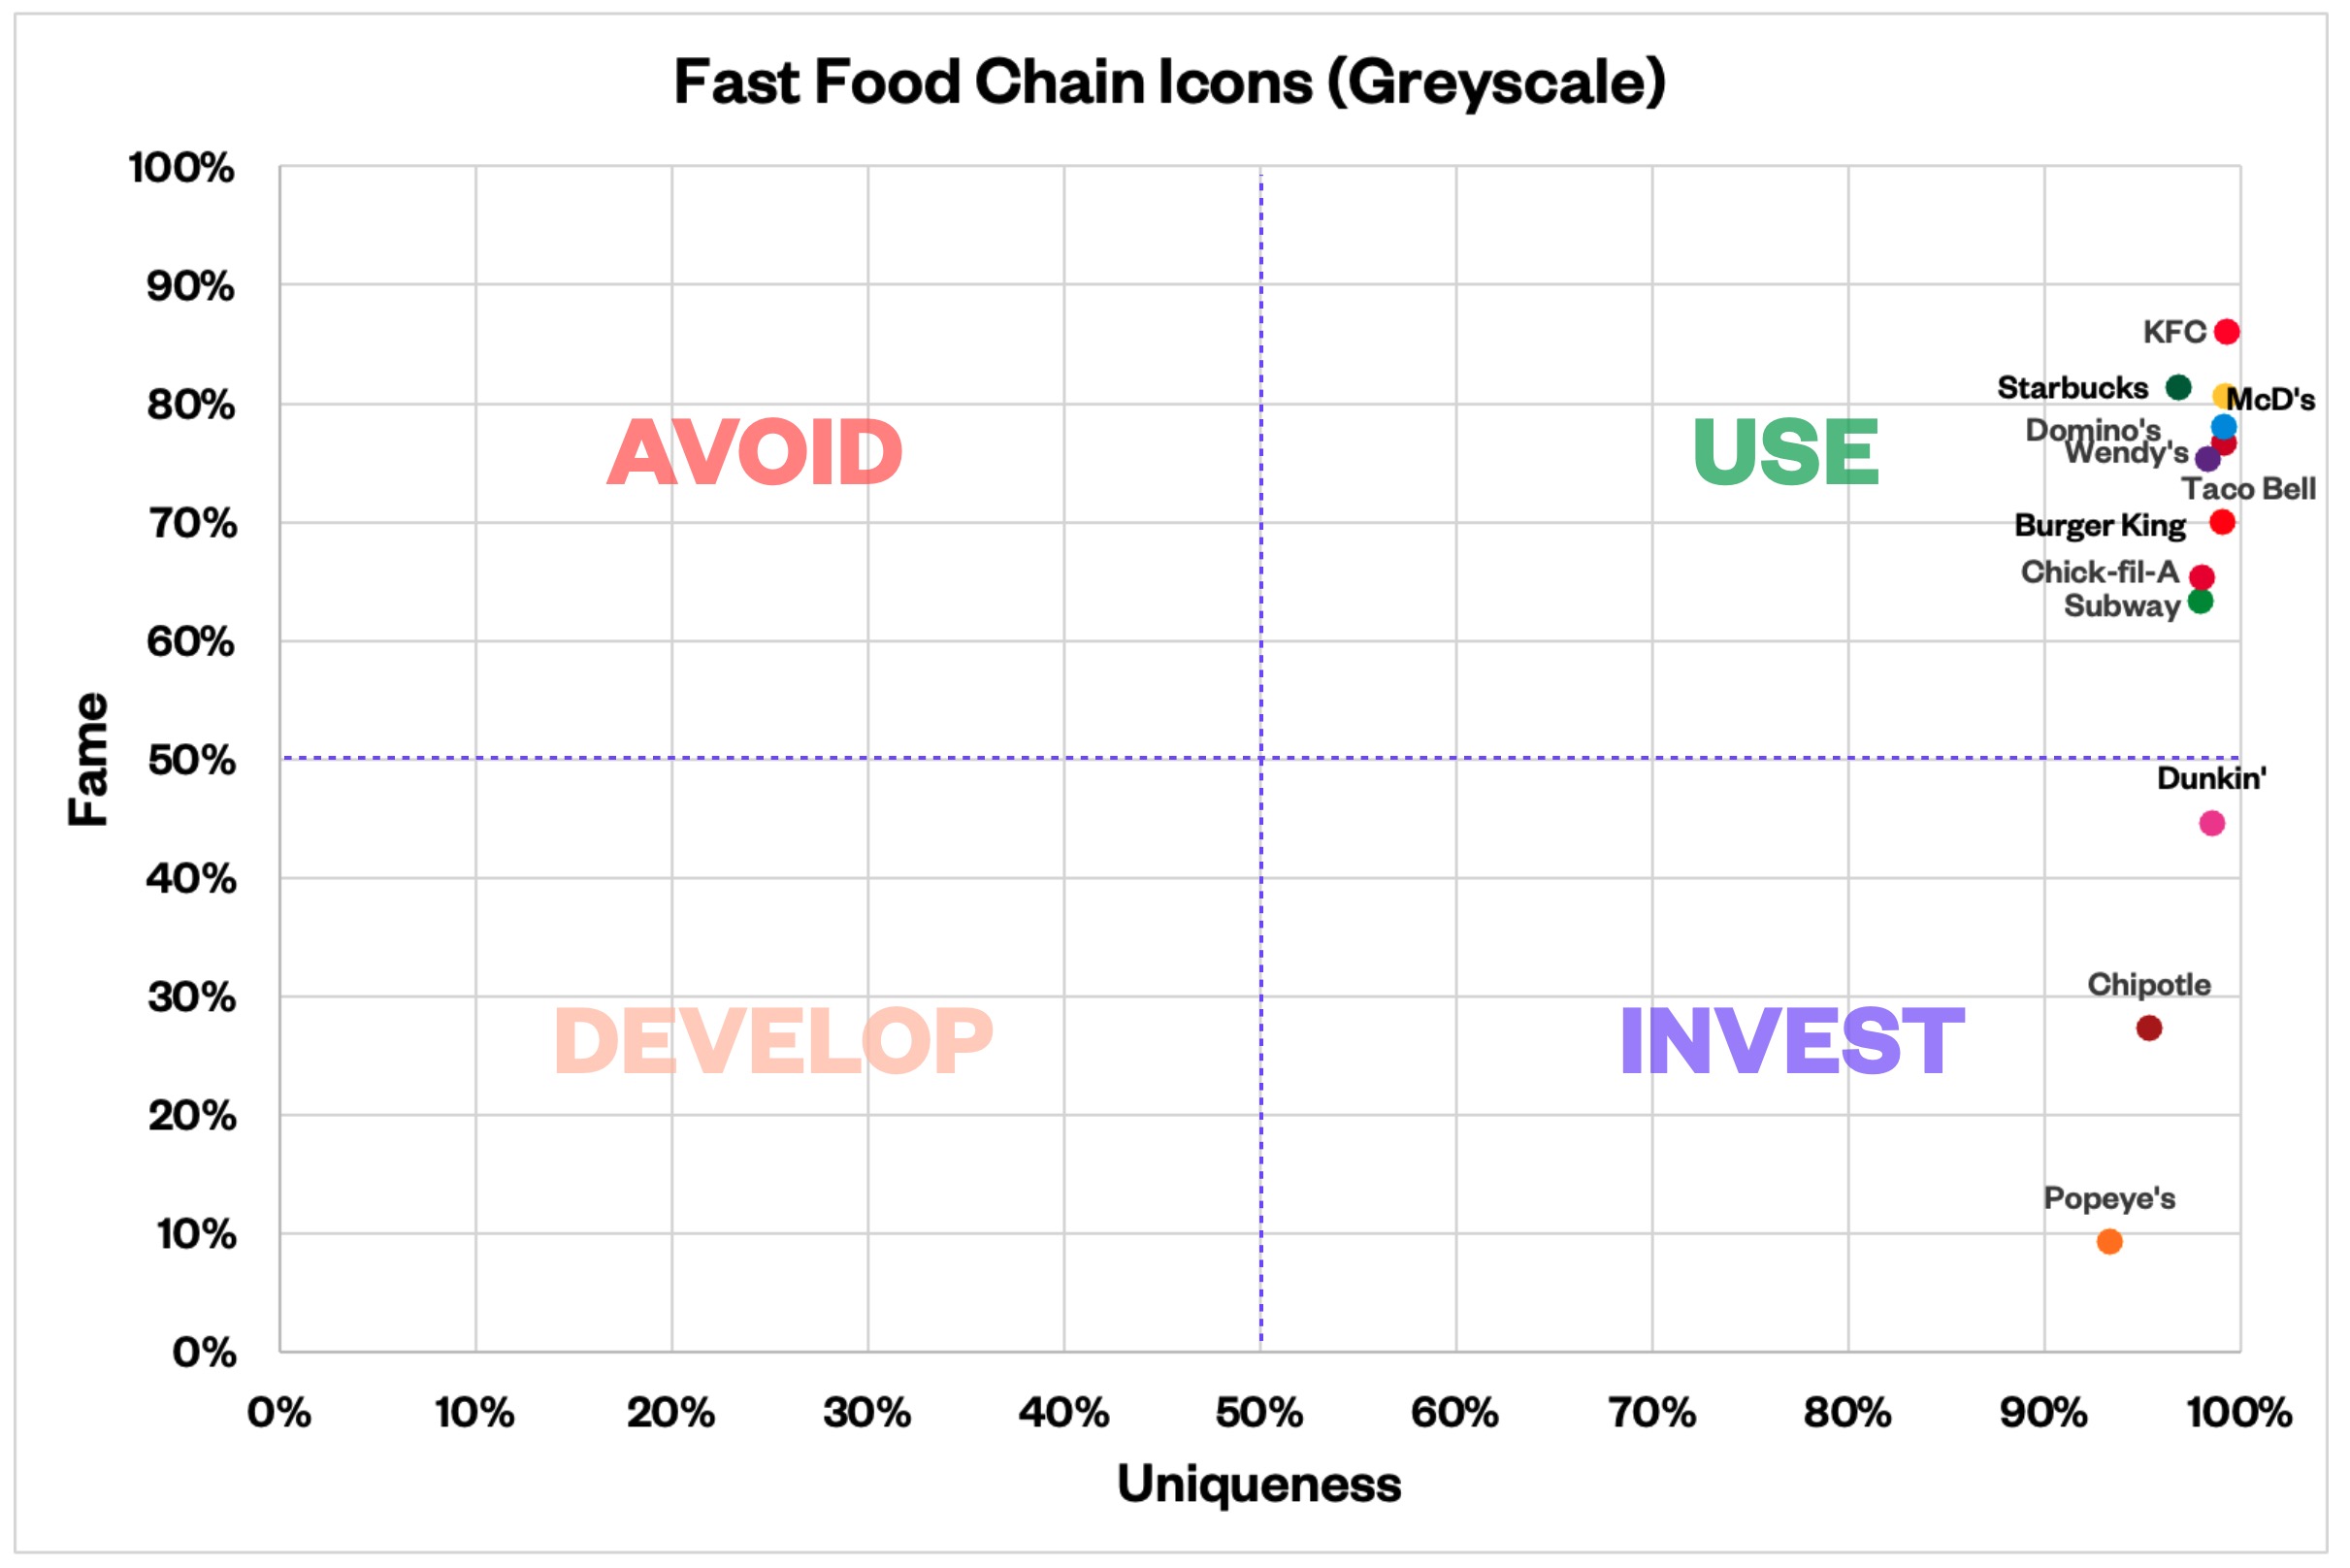
Step 1: Select your competitive set - Include 5-8 direct competitors in your category. For fast food (Image 1), that's McDonald's, Burger King, Subway, KFC, Wendy's, Chick-fil-A, Domino's, etc.
Step 2: Test the same asset type across all brands - If you're testing your icon, test competitor icons simultaneously. If testing colors, test competitor color schemes. Image 3 shows icon testing across six fast food brands, same format, same context, different icons.
Step 3: Randomize asset presentation order The platform automatically randomizes which assets respondents see first to eliminate order bias.
Step 4: Use identical test questions Ask the exact same attribution question for all assets: "Which brand does this [color/icon/shape] belong to?"
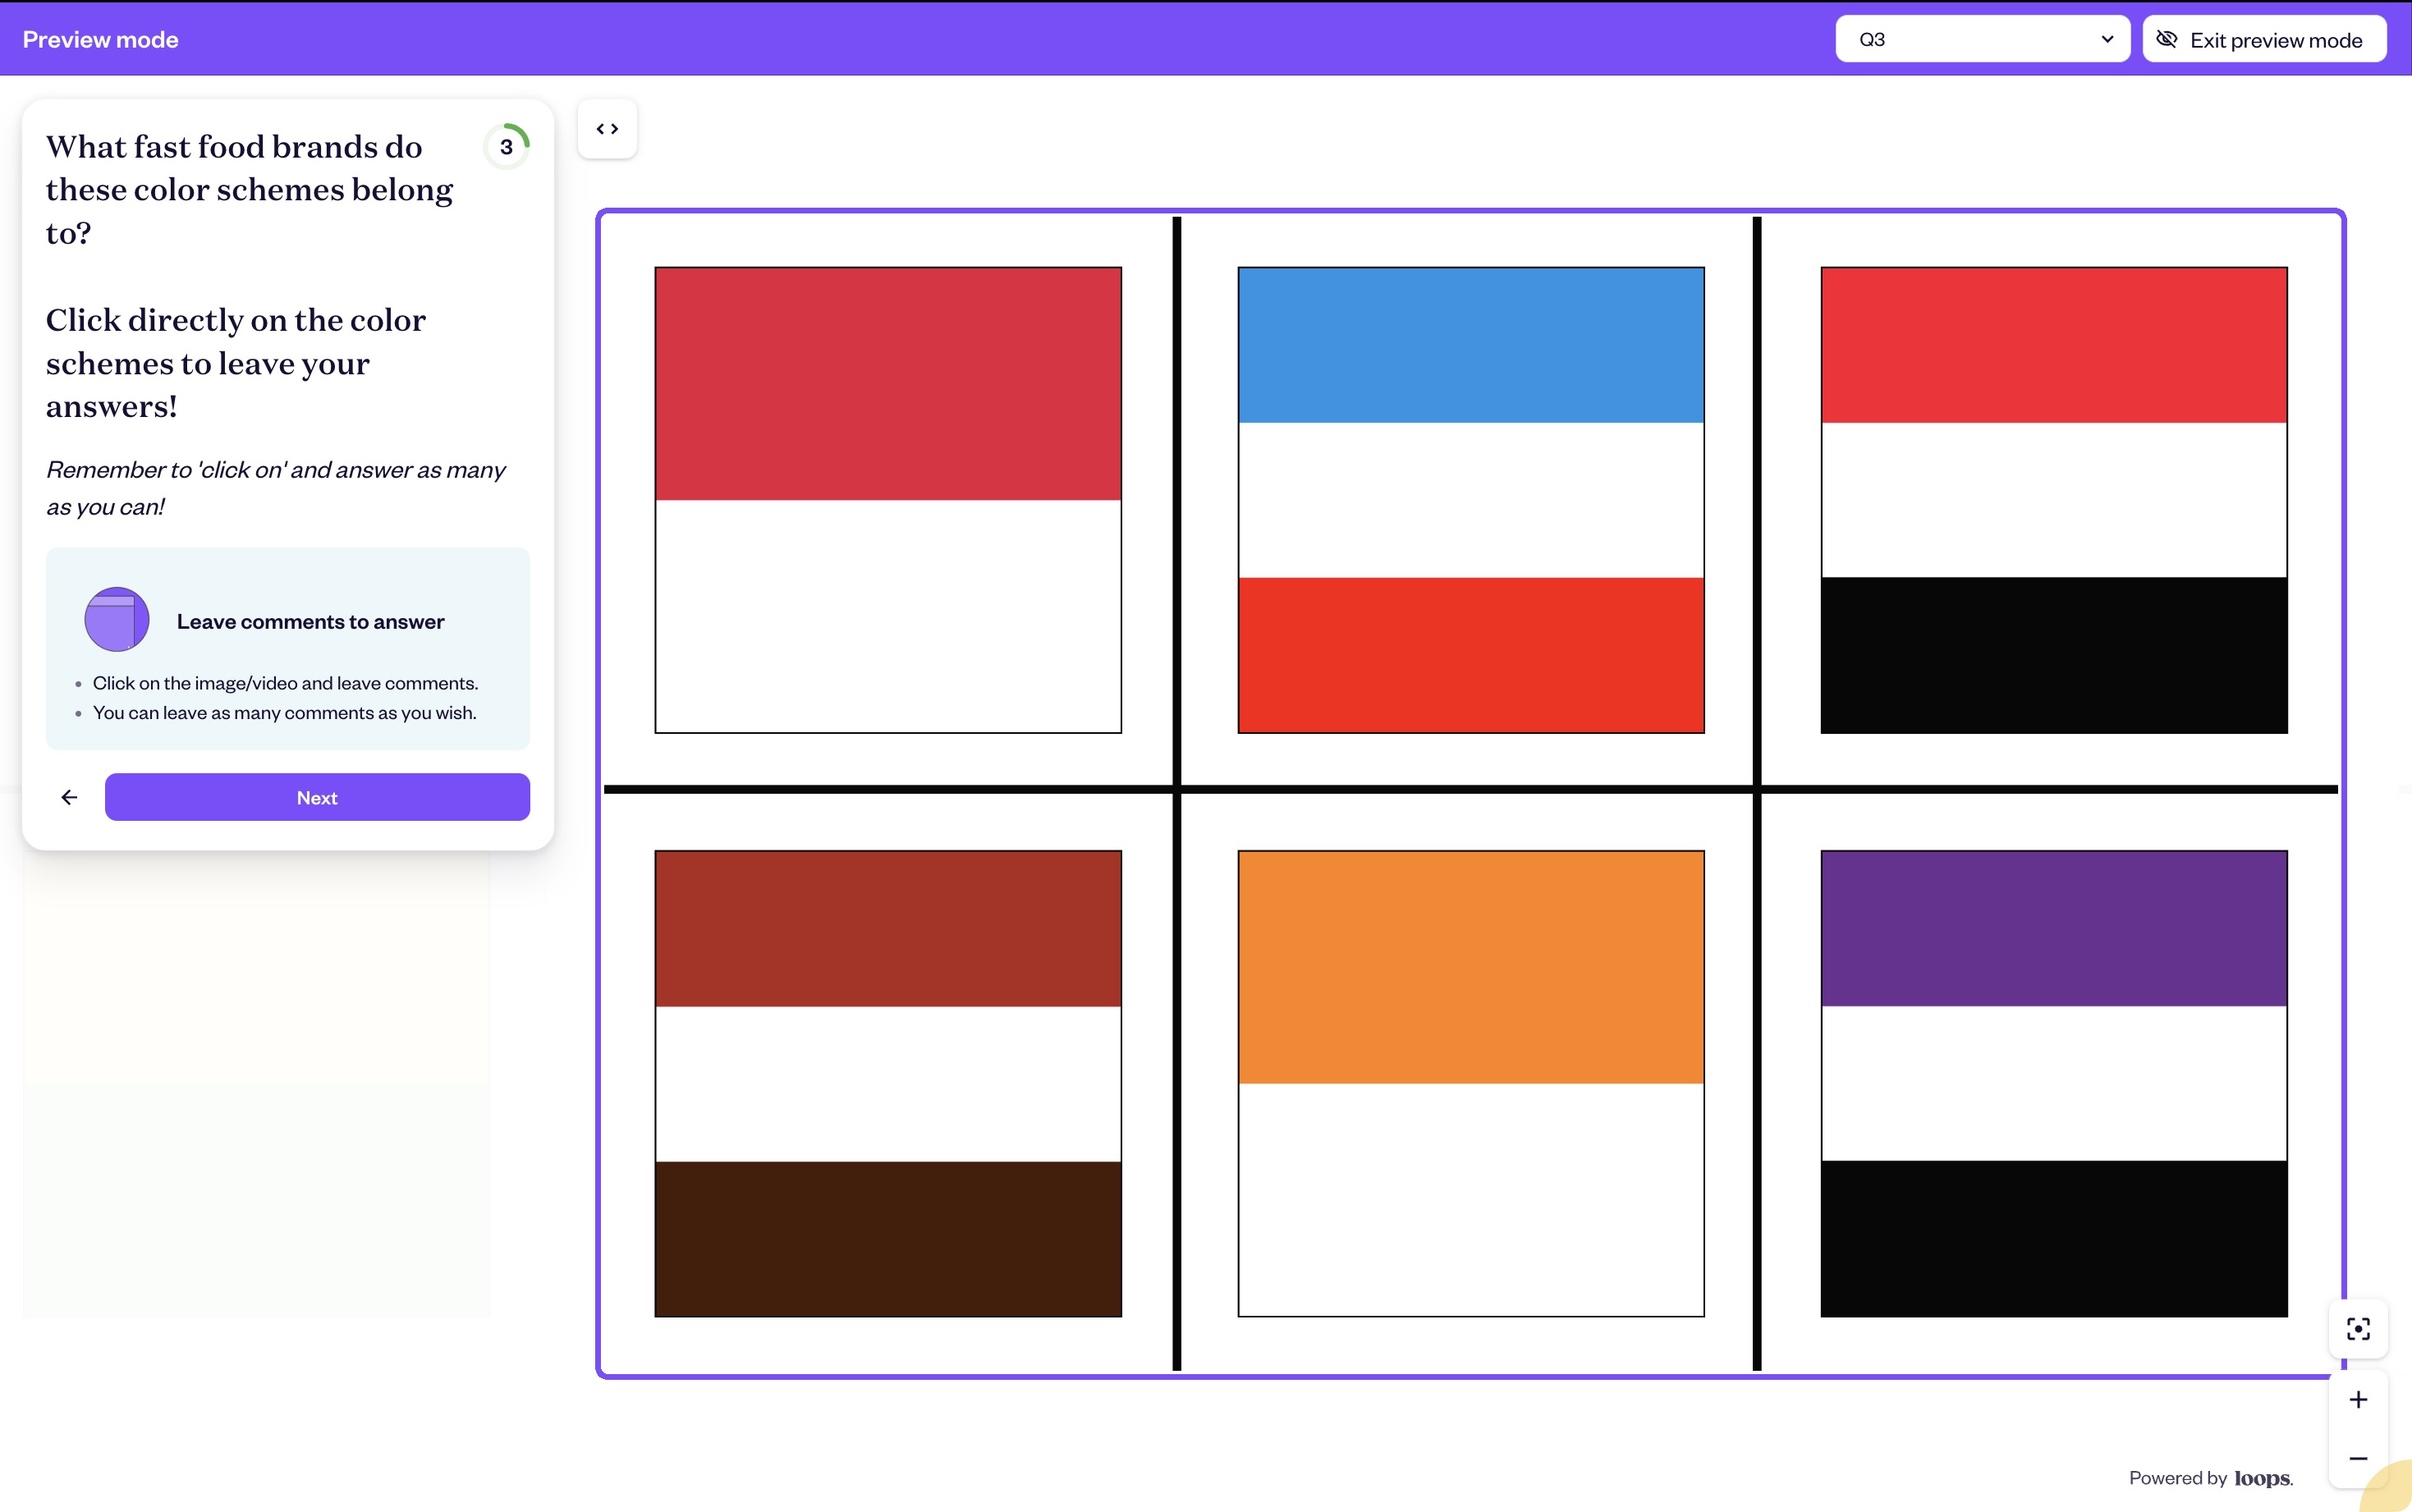
Category colour testing in Loops
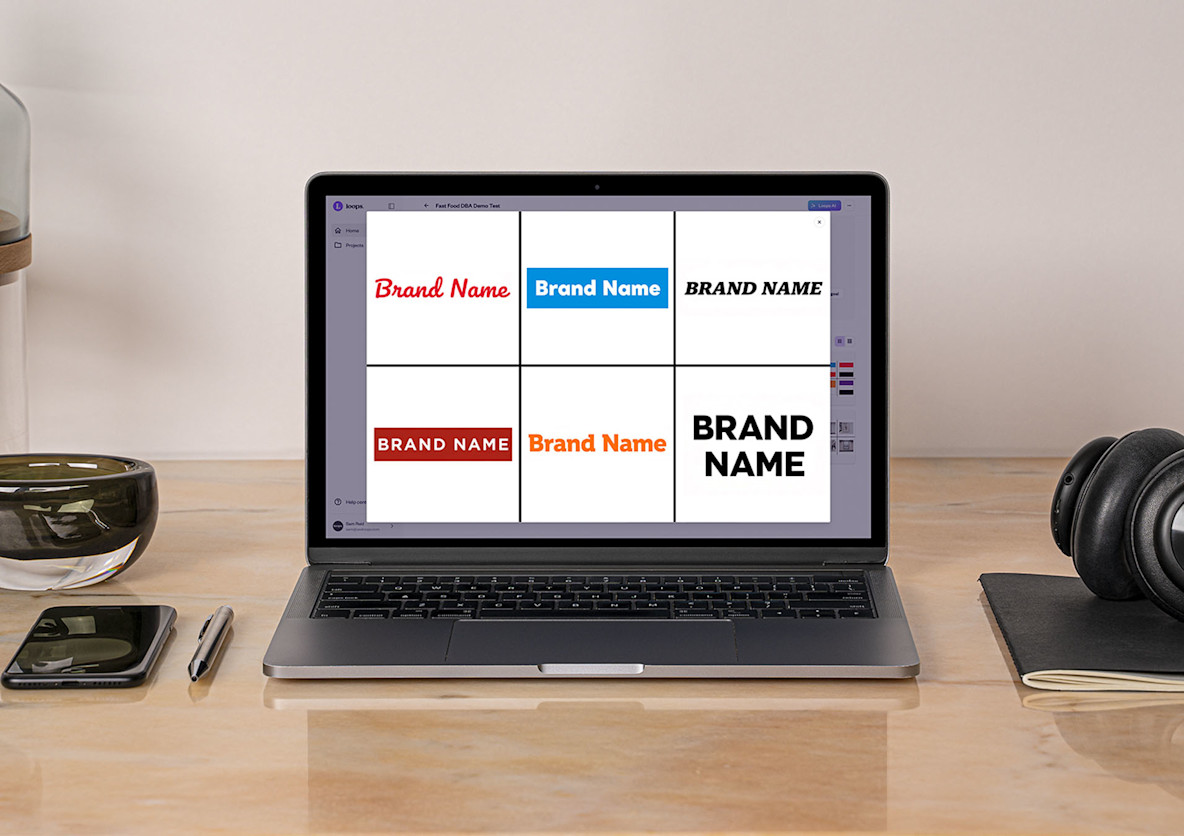
The example image above demonstrates category-level color testing. Six different fast food brand color schemes, presented identically as horizontal color blocks. No logos, no text, no context clues beyond the colors themselves.
This reveals which brands have genuinely distinctive color assets versus which are using generic category colors. If multiple brands test similarly on red/white combinations, none of them own that color pairing in consumer minds.
Step 3: Interpret Fame and Uniqueness Scores
The Ehrenberg-Bass methodology produces two metrics for each asset:
Fame: Percentage of respondents who correctly attributed the asset to your brand
Uniqueness: Percentage who attributed it exclusively to your brand (no competitor mentions)
The question Loops asks is intentionally simple: "Which brand do you think this belongs to?"
Respondents can provide multiple answers if the asset reminds them of several brands. This captures the reality of confused or shared asset distinctiveness.
Testing distinctive brand assets inside Loops
Calculating the Scores
Fame calculation:
(Respondents who mentioned your brand ÷ Total respondents) × 100
If 124 out of 200 respondents correctly identified your asset, that's 62% Fame.
Uniqueness calculation:
(Respondents who mentioned ONLY your brand ÷ Respondents who mentioned your brand) × 100
If 124 people mentioned your brand but 30 of them also mentioned competitor brands, your Uniqueness (94 ÷ 124) × 100 = 76%.
What the Scores Mean
Consider an asset "distinctive" when it achieves:
Fame >70% (widespread recognition)
Uniqueness >60% (minimal competitor confusion)
These benchmarks vary by category. In crowded categories like fast food or soft drinks, achieving 70% Fame is harder than in less competitive categories.
The example image below shows actual category-level results. Starbucks achieved 124 brand mentions when testing their assets, significantly higher than competitors in the same test. That's evidence of strong Fame. The platform automatically calculates whether those mentions were exclusive (Uniqueness) or included competitor confusion.
Brand testing results in Loops
Step 4: Understand Asset Recognition Drivers
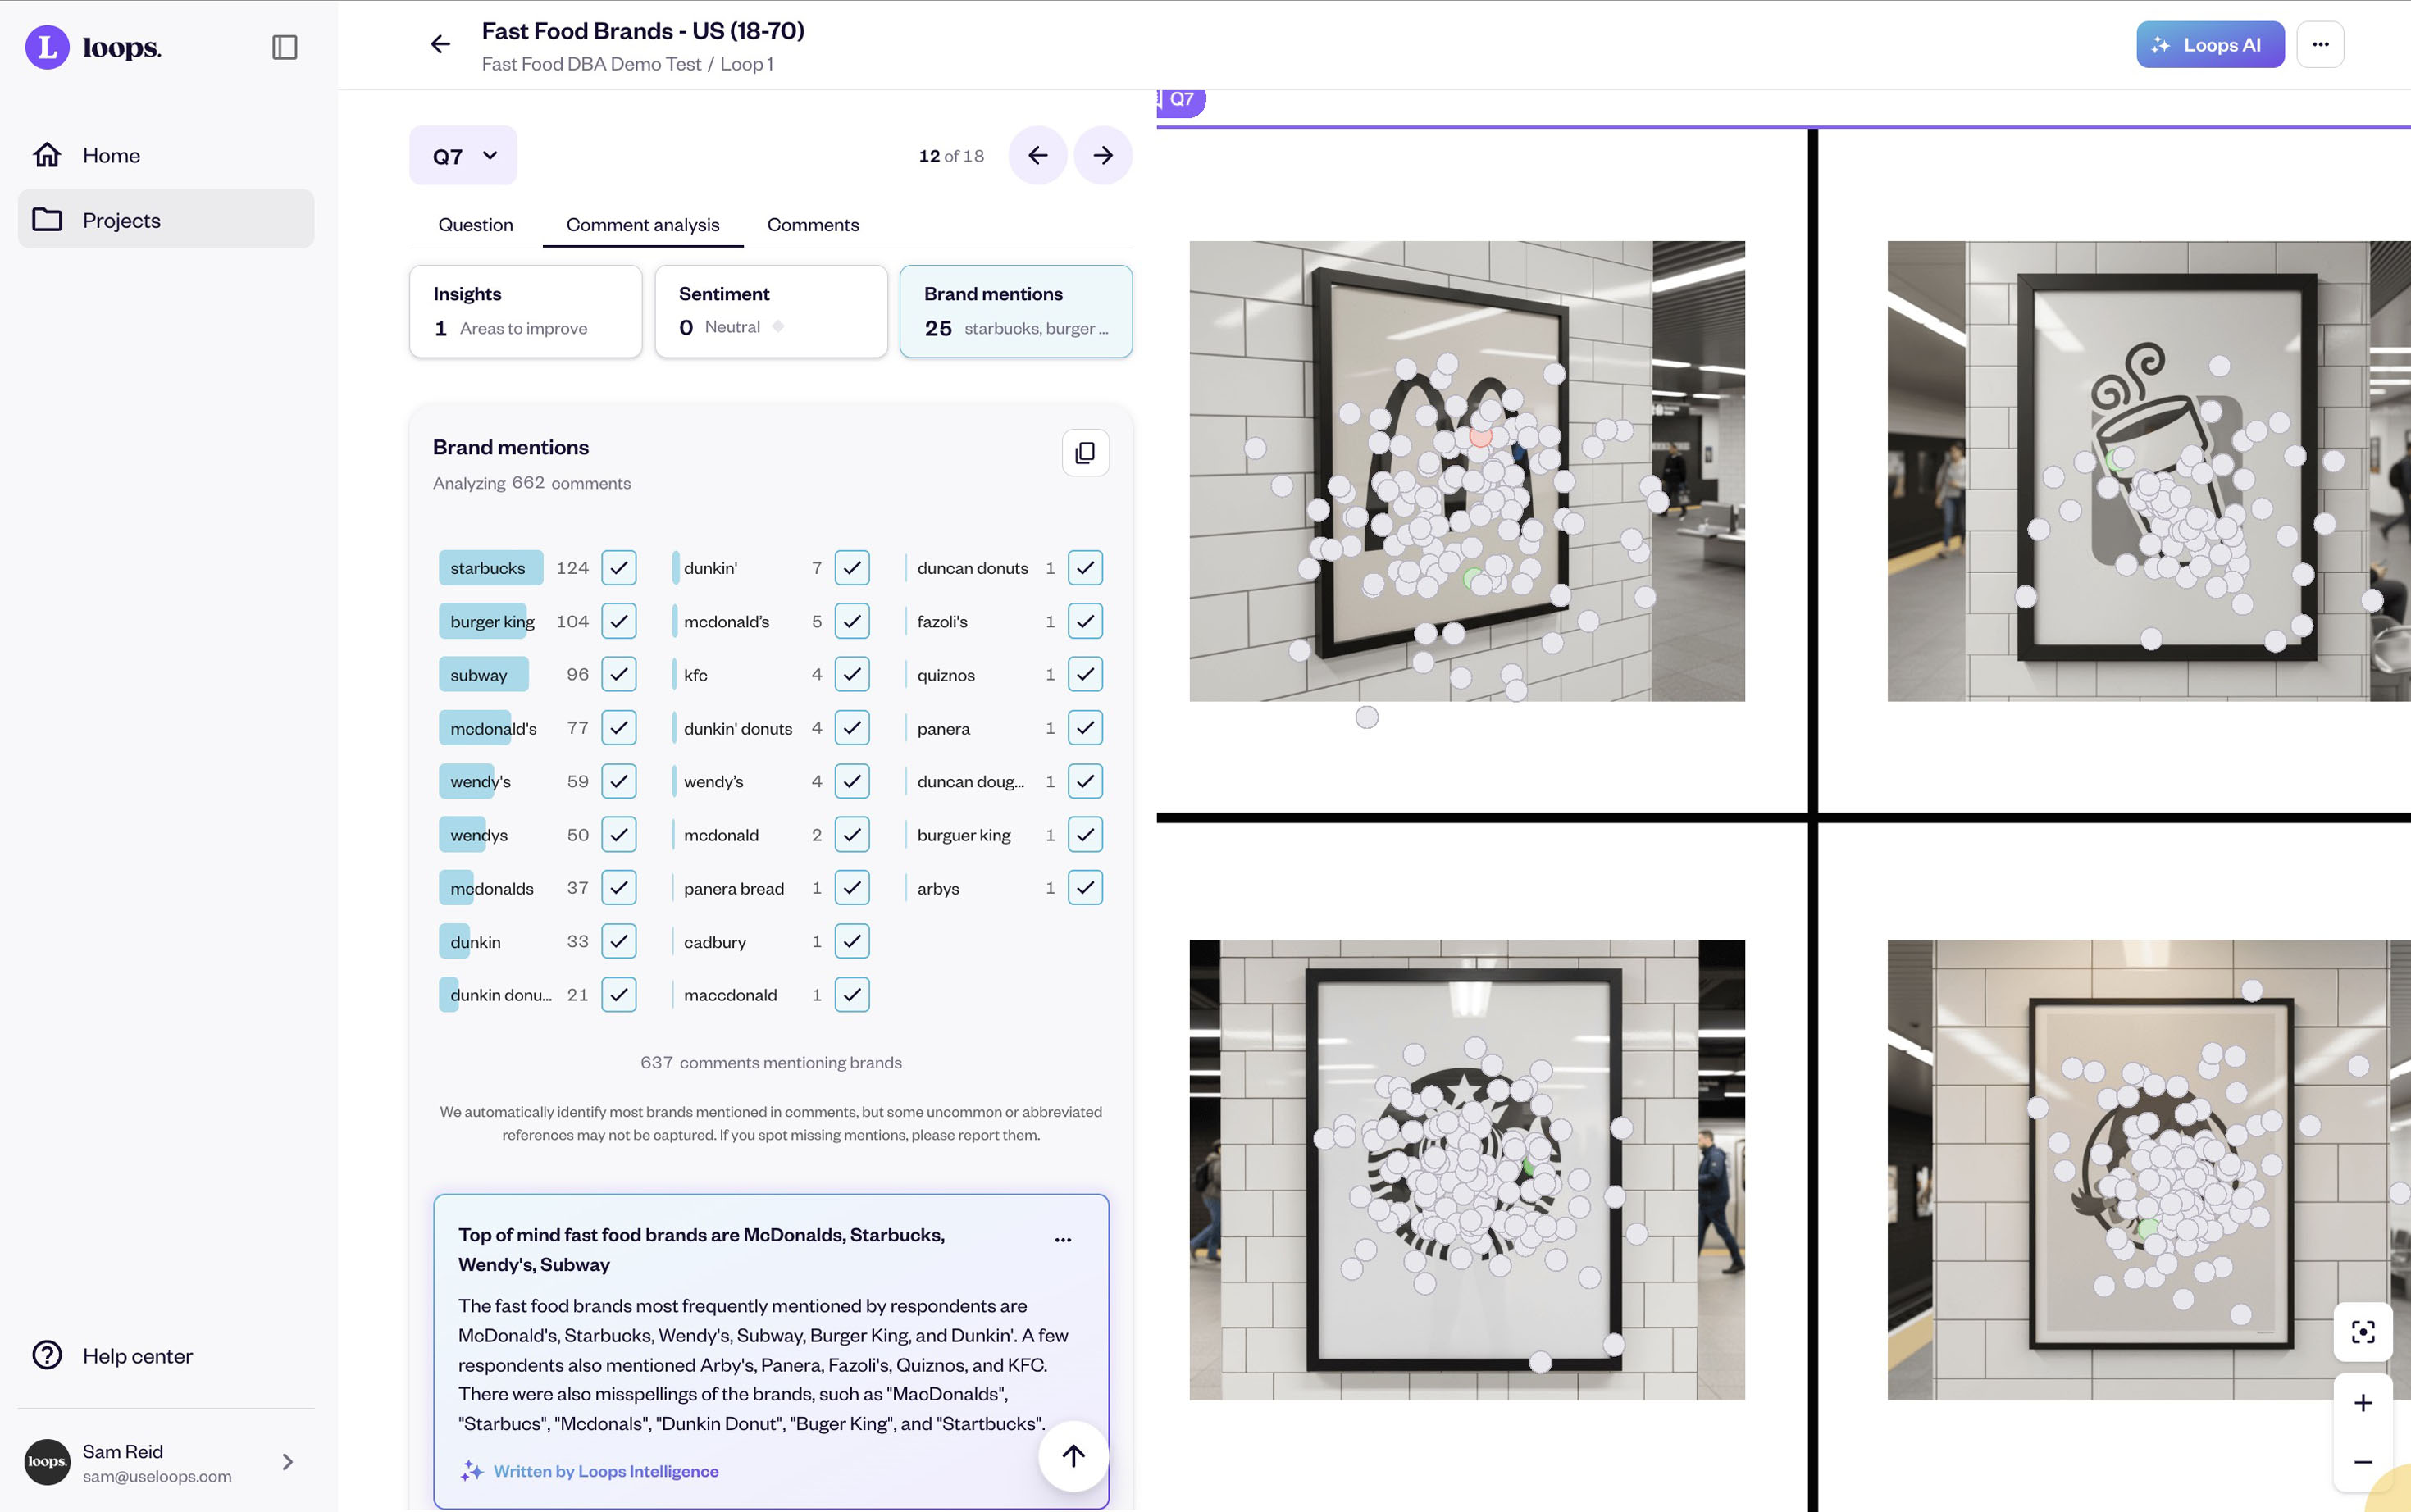
The Loops platform collects point-and-click responses on visual assets. Respondents can click directly on the parts of an image that triggered brand recognition or caused confusion.
The Fame/Uniqueness Matrix
Plot your assets on a 2×2 matrix:
High Fame, High Uniqueness: Protect and maintain these assets. They're working.
High Fame, Low Uniqueness: Widely recognized but confused with competitors. Consider differentiation or accept that you're sharing the asset with a competitor (and potentially promoting them inadvertently).
Low Fame, High Uniqueness: Distinctive but unknown. Increase exposure and consistency, e.g, spend more on media.
Low Fame, Low Uniqueness: Weak assets. Consider replacement or major modification.
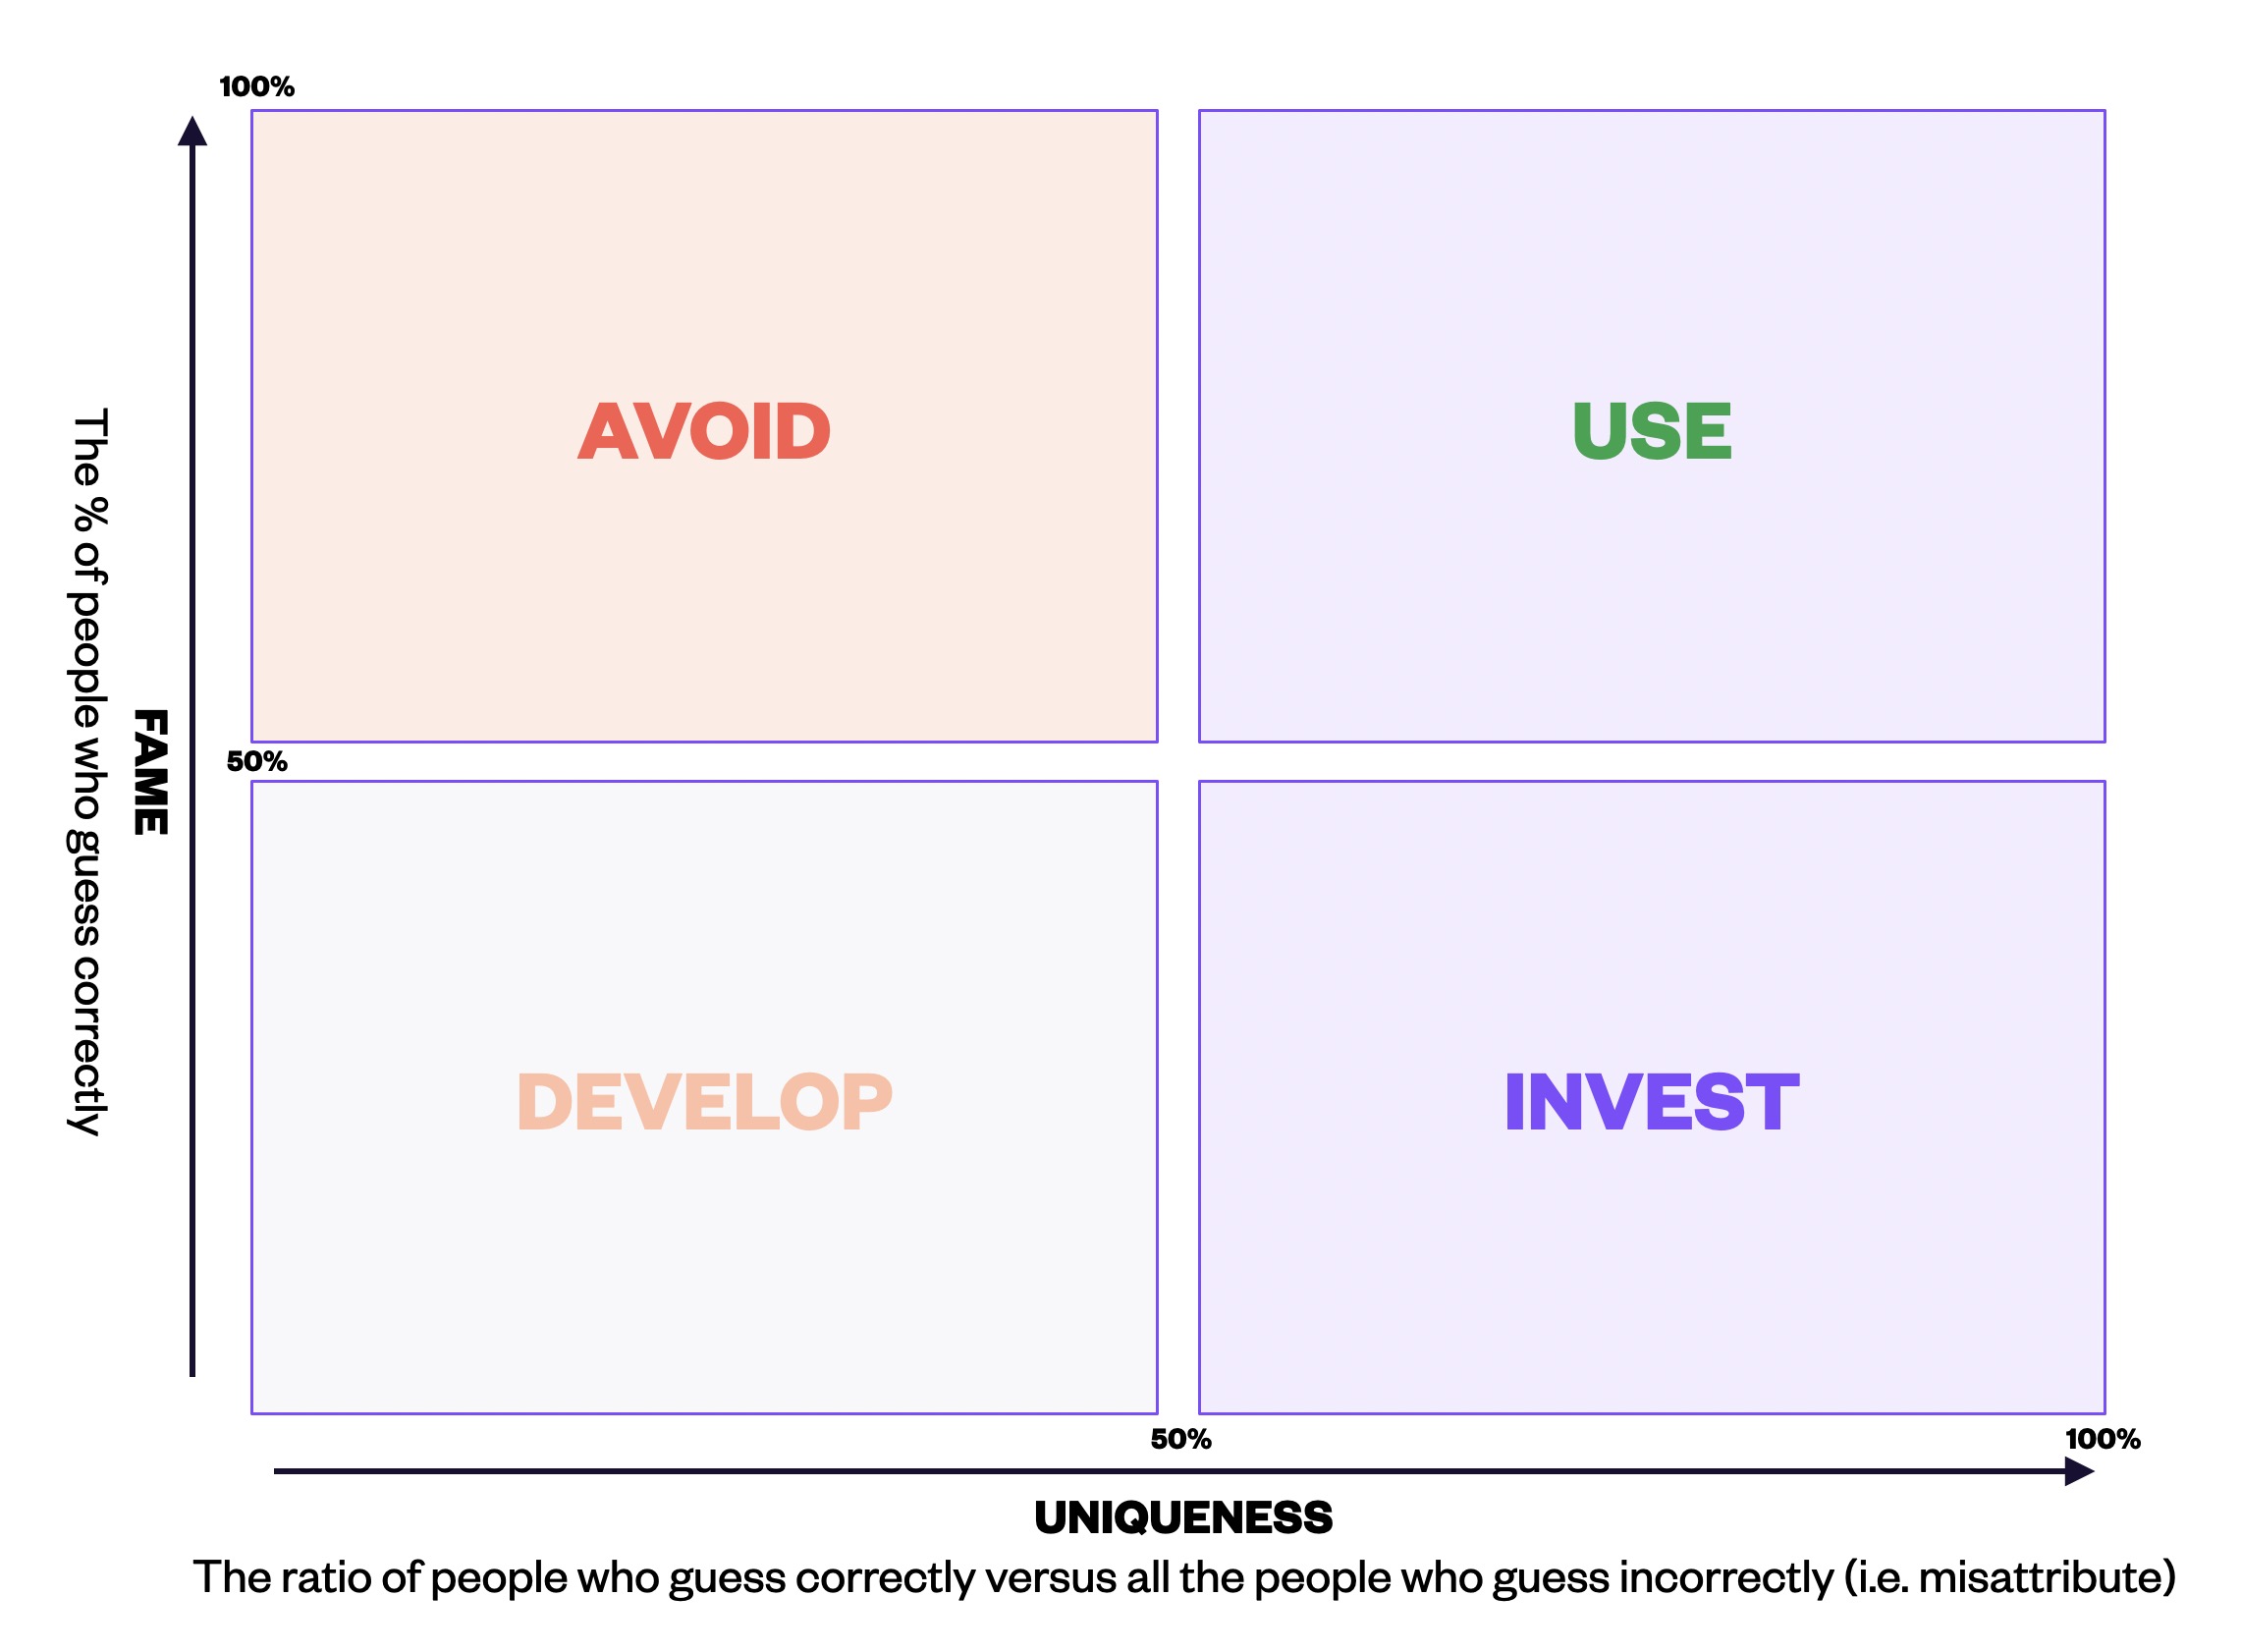
Fame versus uniqueness
Where brand icons score
Step 5: Take Relevant Actions Based on Results
For assets scoring High Fame, Low Uniqueness:
These assets are recognized widely but confused with competitors. When you feature them prominently in advertising, you risk building mental availability for multiple brands, not just yours.
Be cautious in marketing communications and don't lead campaigns with assets that trigger competitor associations.
Run A/B tests comparing current versus differentiated versions. If a variant drops Fame by 10% but improves Uniqueness by 30%, you're building distinctive mental availability rather than shared category awareness, likely a net positive.
If variants still underperform on Uniqueness, shift marketing emphasis to your High Fame, High Uniqueness assets while you develop replacements. Better to feature assets that deliver clean brand-specific recognition.
For assets scoring Low Fame, High Uniqueness:
These assets are working, consumers who know them don't confuse them, but not enough consumers know them yet. The solution isn't modification, it's increased exposure and consistency.
Test the same asset again in 6-12 months after increased marketing investment. Fame should improve if you're maintaining consistency.
For assets scoring Low Fame, Low Uniqueness:
These require rethinking. Test completely new asset concepts in parallel:
Generate 3-5 alternative designs
Run comparative DBA tests across all alternatives
Select the variant with highest Fame/Uniqueness potential
Iterate that winner through refinement testing
Speed Advantage of Loops Testing
Traditional research firm timeline for one round of DBA testing: 8-12 weeks
Loops timeline: 3-5 days for results
This speed enables iteration. You can test, modify, retest, and optimize within the timeframe traditional firms take for a single study.
Real implementation example: A global CPG brand tested 4 packaging redesign concepts simultaneously. Results in 4 days. Modified the top 2 performers based on pixel-level feedback. Retested refined versions. Final validation done. Total elapsed time: 2 weeks. Traditional timeline for the same process: 3 months.
What You Can Test With This Methodology
Adding distinctive brand assets to Loops
Visual assets:
Logos and icons (with/without text)
Color palettes and combinations
Packaging shapes and structures
Pattern elements (checks, stripes, textures)
Typography and font styles
Character mascots or brand symbols
Contextual presentations:
On-shelf presence vs competitors
Out-of-home advertising visibility
Digital interface recognition
Print advertisement standout
Product-in-use scenarios
Asset variations:
Full logo vs simplified icon
Primary color vs secondary color
Complete design vs minimal version
Different color intensity levels
Alternative font weights or styles
Each test delivers Fame and Uniqueness scores within days, enabling systematic optimization of your entire brand asset portfolio.
With Loops you can test any DBA e.g. audio, characters, and mascots etc.
Setting Up Your First DBA Test in Loops
The platform walks you through a structured workflow:
Upload your assets → AI decomposition automatically separates elements
Select your test markets → 85+ markets available, respondent panels pre-recruited
Choose competitive benchmarks → Add competitor assets for category context
Configure test questions → Platform provides Ehrenberg-Bass inspired question templates
Launch and collect responses → Results typically complete in 72-96 hours
Review Fame/Uniqueness scores → Automatic calculation, visual matrix placement
Revise strategy accordingly → prioritize actions based on results
The entire process from upload to results: under one week.
Test Your Distinctive Brand Assets Before You Commit to Them
Some brands discover their "signature" assets aren't actually distinctive until they test them properly. Better to know before you spend another decade reinforcing assets that don't work.
The Ehrenberg-Bass methodology gives you the framework. The Loops platform gives you the speed and category context to implement it effectively.
Test your current assets. Benchmark against competitors. Iterate based on real consumer attribution data. Build genuine distinctiveness rather than hoping for it.
Ready to validate your brand assets with category-competitive testing? Book a demo with Loops to set up your first distinctive brand asset study. Results in days, not months.